In this post I’m taking a look at the USDCAD, but first I want to make a couple comments on last week’s post where I discussed the CHFJPY.
The support discussed last week held and we did see the pair (CHFJPY) bounce which was started by a big bullish engulfing candle on the daily chart. Also, if you take a look the 4 hour chart, there was a doji followed by a confirming green candle and later on a bullish engulfing candle as possible entries. I rarely trade intraday, but love watching how these pairs react to support and resistance levels on the intraday charts over weekends when the markets are closed; I learn a lot that way. That’s it for CHFJPY, just remember that anything can happen at any time in the market, and CHFJPY will move where it wants to move from here; always manage risk.
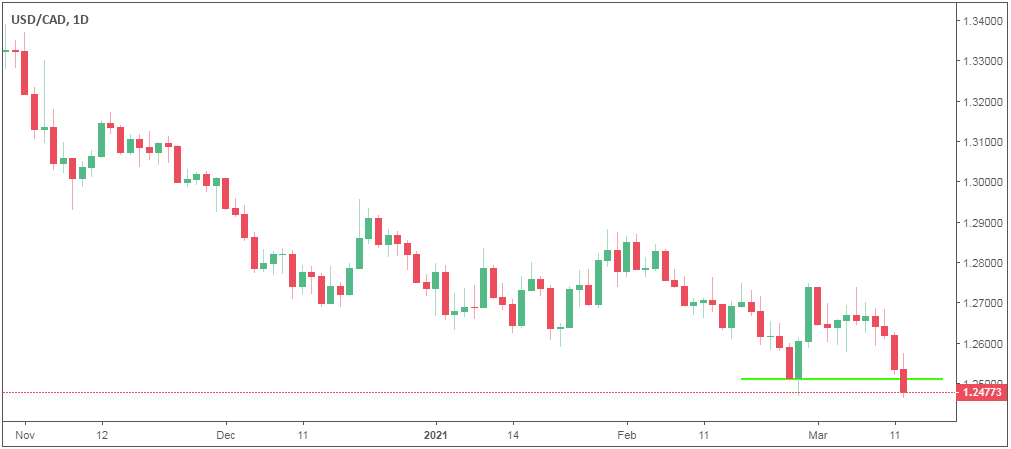
See the daily chart of USDCAD below for the discussion that follows:

The USDCAD broke most recent support this week making another lower low on the daily chart in the process and suggesting that it might go even lower. The reason I’m posting this chart this week is because all the other major USD pairs are very strong in comparison to the USDCAD. In a chart like this I would like to see the pair test resistance (previous support) and give a candlestick pattern as confirmation to enter short. Let’s see what happens this week.
On Ideas: Please don’t take this as trading advise. Please do your own due diligence before entering any trade. Also see Disclaimers.
Thanks for reading.
Thanks and Regards,
Trading SOS SOS

1 Comment.
[…] weekend I wrote about the USDCAD that made a lower low here. I suggest you read that post first before reading this […]