The Moving Average Convergence / Divergence (MACD) indicator is a very popular indicator developed by Gerald Appel. This post delves into the MACD indicator. Ready to learn more? Please read on.
The Moving Average Convergence / Divergence (MACD) Indicator:
What is the MACD?
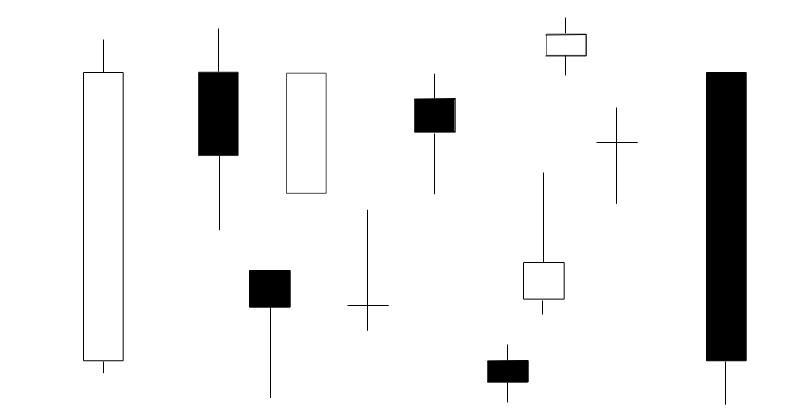
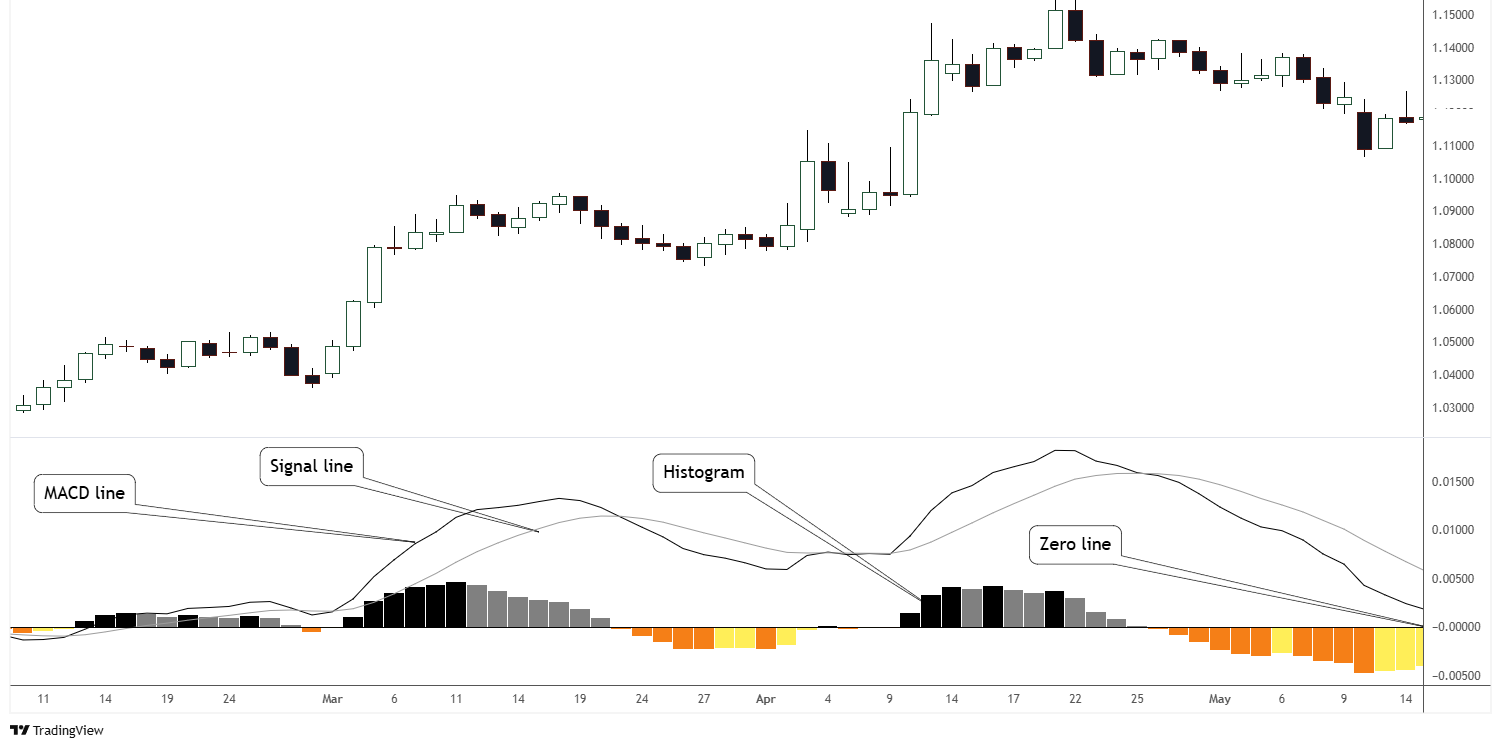
The MACD is a momentum indicator used to identify and trade trends. It is normally charted in a sperate panel on a chart and consist of 2 lines, the MACD line and the Signal line. A histogram is also often plotted, which gives a different visual representation of the two lines.
The MACD identifies trends by plotting the distance between 2 Exponential Moving Averages (EMA’s). The 2 Moving Averages used in the calculation are normally the 26 (slow) and 12 (fast) EMA’s. A 9 period Exponential Moving Average is then taken of the MACD, which is called the Signal line.
As discussed above, the MACD and the Signal line are often represented as a Histogram. This Histogram is the difference between the MACD and the Signal line. When the MACD line is above the Signal line, the Histogram is positive (above the zero line), and when the MACD line is below the Signal line, the Histogram is negative (below the zero line).
In short:
- 26 EMA of price (slow EMA).
- 12 period EMA of price (fast EMA).
- MACD = the difference between the 2 EMA’s.
- The signal line is a 9 period EMA of the MACD.
- Histogram = the difference between the MACD and Signal line.
The 26, 12 and 9 values are the default settings that comes with most charting software. These values can be changed, testing them first is always recommended.
When the 2 lines move away from each other (Histogram bars increasing), they are diverging. When they move closer to each other (Histogram bars decreasing), they are converging. Hence, Moving Average Convergence / Divergence.
See below:
How to Interpret the MACD?
Below are the 4 main ways in which the MACD can be used:
MACD line Crossing the Signal line:
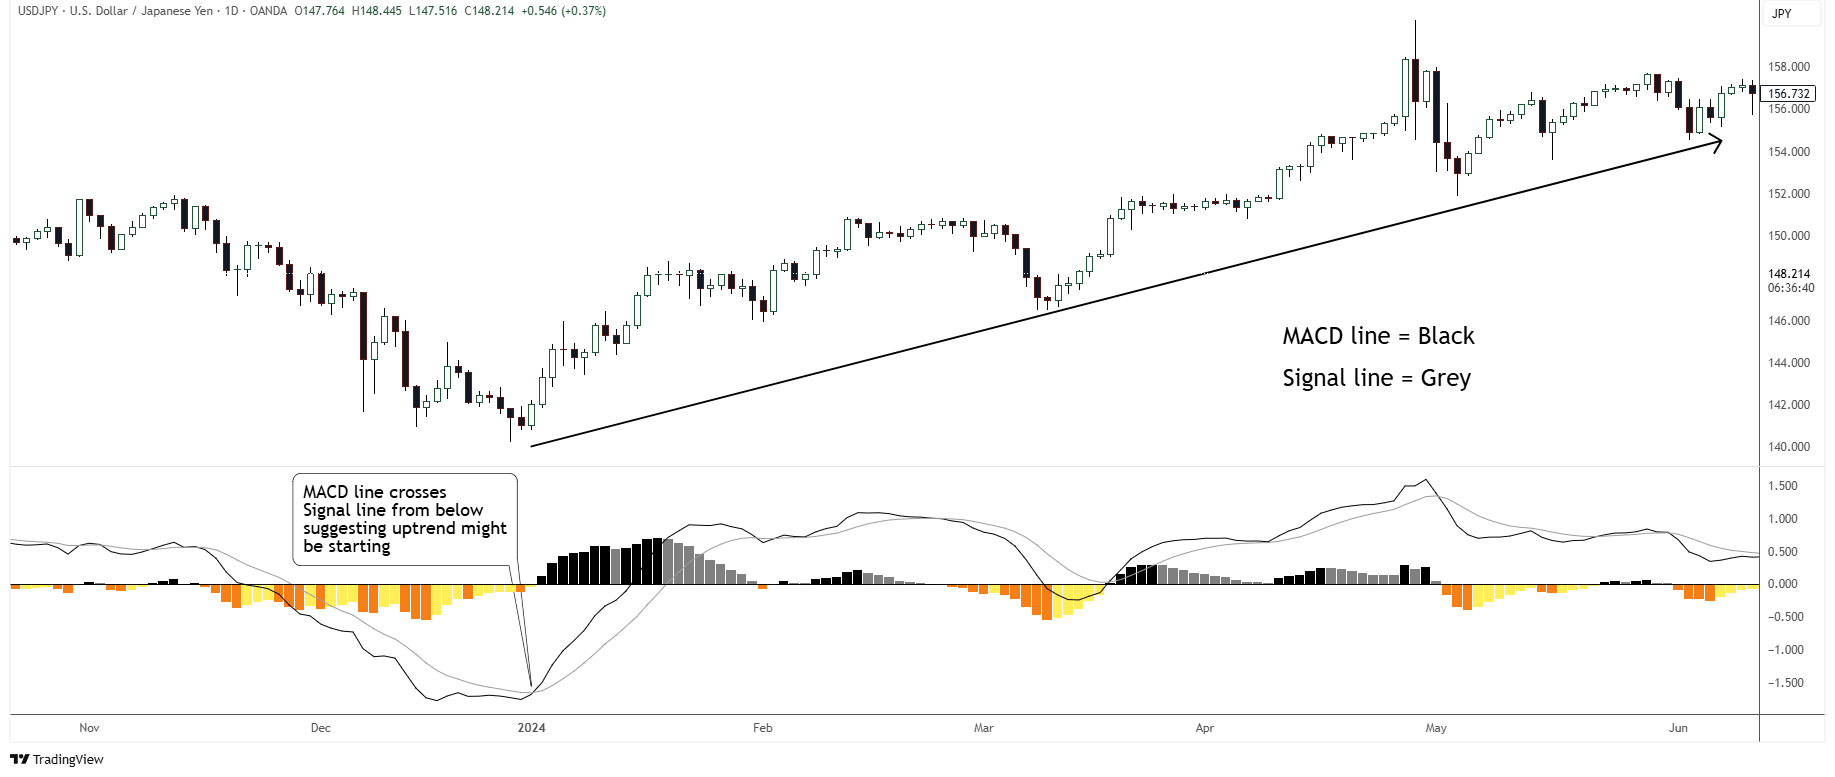
Since the Signal line is a Moving Average of the MACD line, the Signal line is slower than the MACD line. Crossovers between theses 2 lines work in a similar manner than traditional Moving Average crossovers.
A trend is considered bullish when the MACD line (faster) crosses the Signal line (slower) from below. A crossover of the Signal line (slower) by the MACD line (faster) from above is considered bearish.
See below:
Crossing of the Zero line:
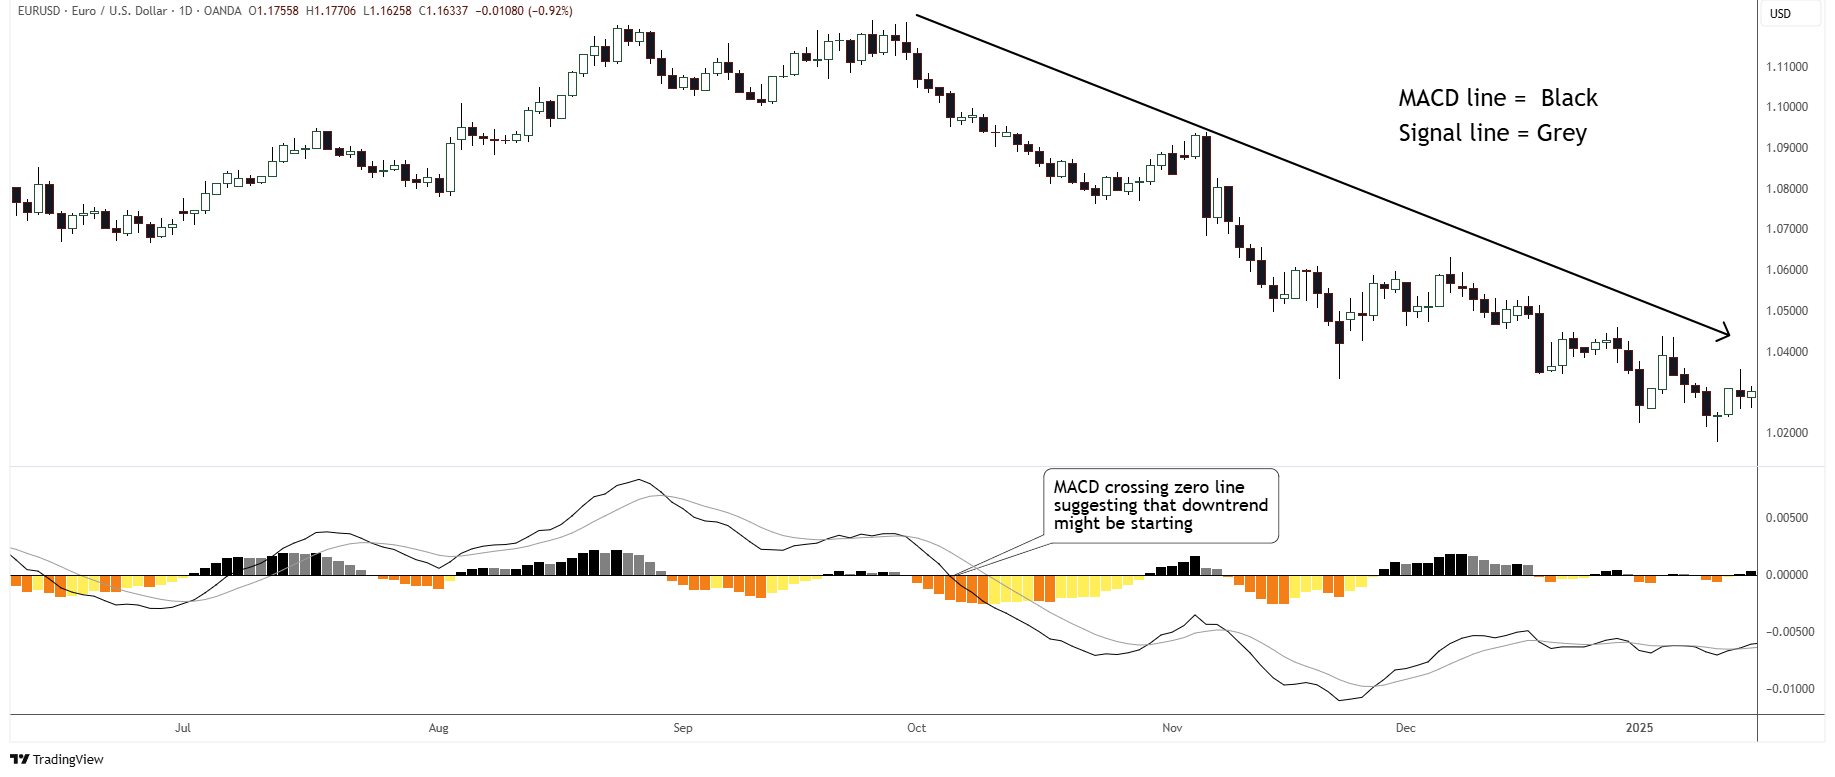
It is considered bullish when the MACD crosses above the zero line and bearish when it crosses below the zero line.
See below:
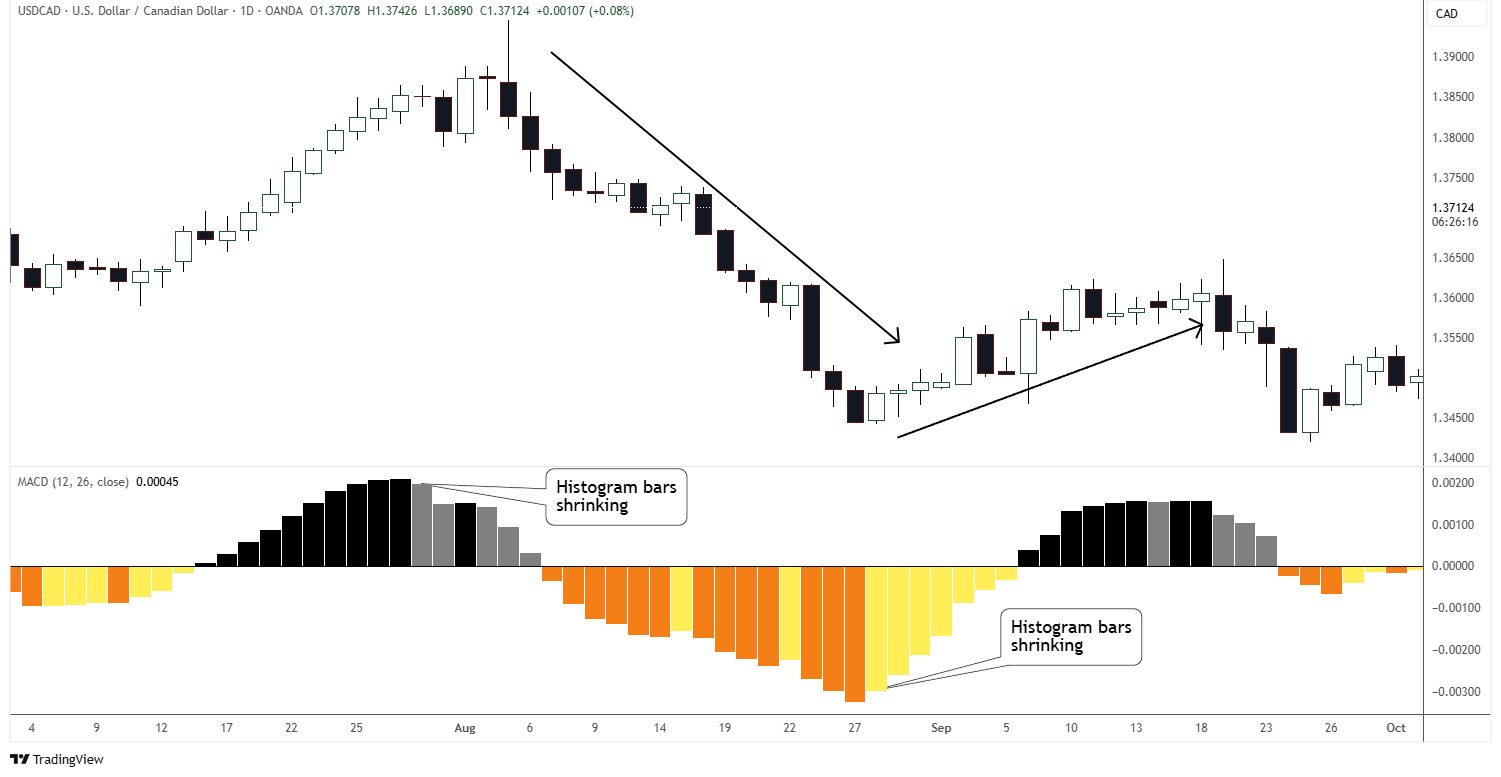
Histogram Momentum Analysis:
Strong price momentum is indicated if the Histogram bars are increasing / expanding – bullish when above zero and bearish when below zero. When these bars start to taper off, meaning that they start decreasing / shrinking in size from the high / low (depending on whether price is in an uptrend or downtrend) of the Histogram, it’s often an early signal that momentum is stalling or getting weaker. This condition suggests that it is a good time to start looking for reversals.
See below:
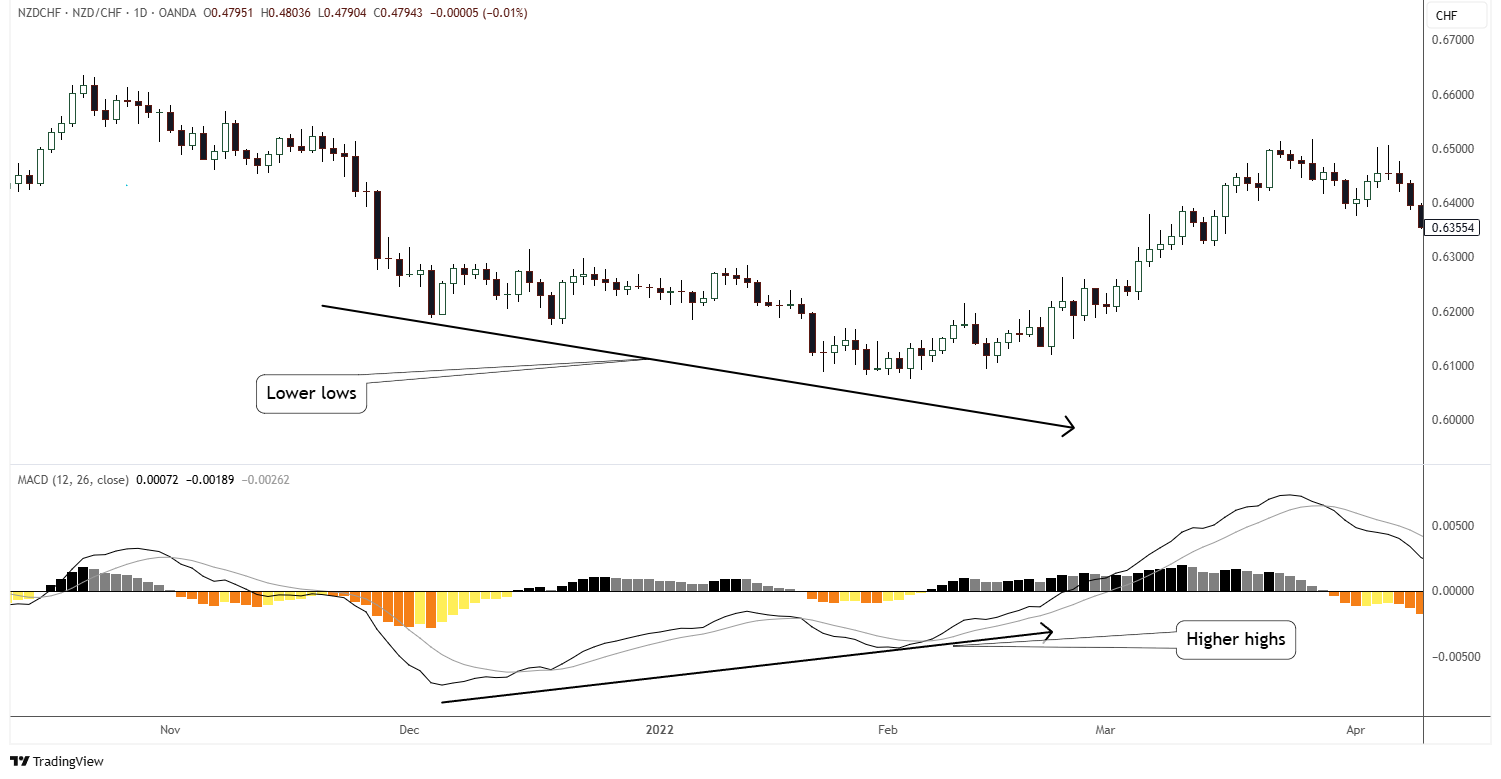
Divergence between the MACD Indicator and Price:
Normally the MACD and price will move in the same direction. This means that higher lows in price are normally accompanied by higher lows in the MACD, and vice versa.
A strong signal occurs when the MACD and price diverges, meaning:
- bullish divergence – price making a lower lows while the MACD makes higher lows, signals that price might reverse to the upside. This is normally a great time to start looking for bullish price signals.
- bearish divergence – price making a higher highs, while the MACD makes a lower highs, signals that price might reverse to the downside. This is normally a great time to start looking for bearish price signals.
See below:
Note: The above charts were cherry picked for explanation purposes. In real trading, charts will not always set up as nicely. As with all indicators, it is best for the trader to study and pick what works best for him / her.
Finally:
There are many indicators out there, the MACD is just one of them. Take your time to find which indicator works best for you.
Thank you for taking time to read this post. I trust you’ve found it useful. All the best with your trading.
Thanks and Regards,
Trading SOS SOS