Charts, Levels and StrategizingCADCHF: Week of 22 January 2024January 20, 2024See daily chart of CADCHF below for the discussion that follows. (more…)Read More
Charts, Levels and StrategizingEURJPY: Week of 15 January 2024January 13, 2024See daily chart of EURJPY below for the discussion that follows. (more…)Read More
Charts, Levels and StrategizingGBPCHF: Week of 8 January 2024January 6, 2024See daily chart of GBPCHF below for the discussion that follows. (more…)Read More
Charts, Levels and StrategizingEURUSD: Week of 1 January 2024December 30, 2023See daily chart of EURUSD below for the discussion that follows. (more…)Read More
Charts, Levels and StrategizingGBPCHF: Week of 25 December 2023December 23, 2023See daily chart of GBPCHF below for the discussion that follows. (more…)Read More
Charts, Levels and StrategizingCADCHF: Week of 18 December 2023December 16, 2023See daily chart of CADCHF below for the discussion that follows. (more…)Read More
Charts, Levels and StrategizingEURGBP: Week of 11 December 2023December 9, 2023See daily chart of EURGBP below for the discussion that follows. (more…)Read More
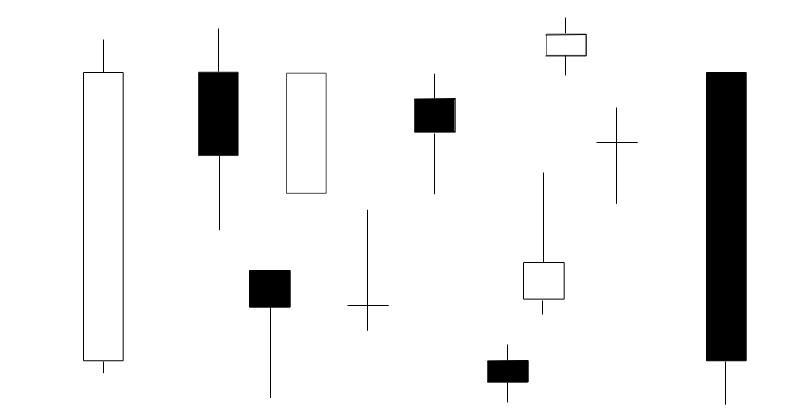
Technical AnalysisCandlestick Bodies and Wicks: Clues they ProvideDecember 2, 2023This post will give a little more insight into what individual candles tell us. You can read more on the basics of candlesticks here. (more…)Read More