This post introduces Bollinger Bands, a very popular trading indicator. Please read on.
What are Bollinger Bands?
Bollinger Bands was created by John Bollinger. It is a technical indicator that is used to gauge volatility and consists of 3 lines that is plotted on a chart. Bollinger Bands fall in a group of indicators called envelopes.
See chart below for the explanation that follows:
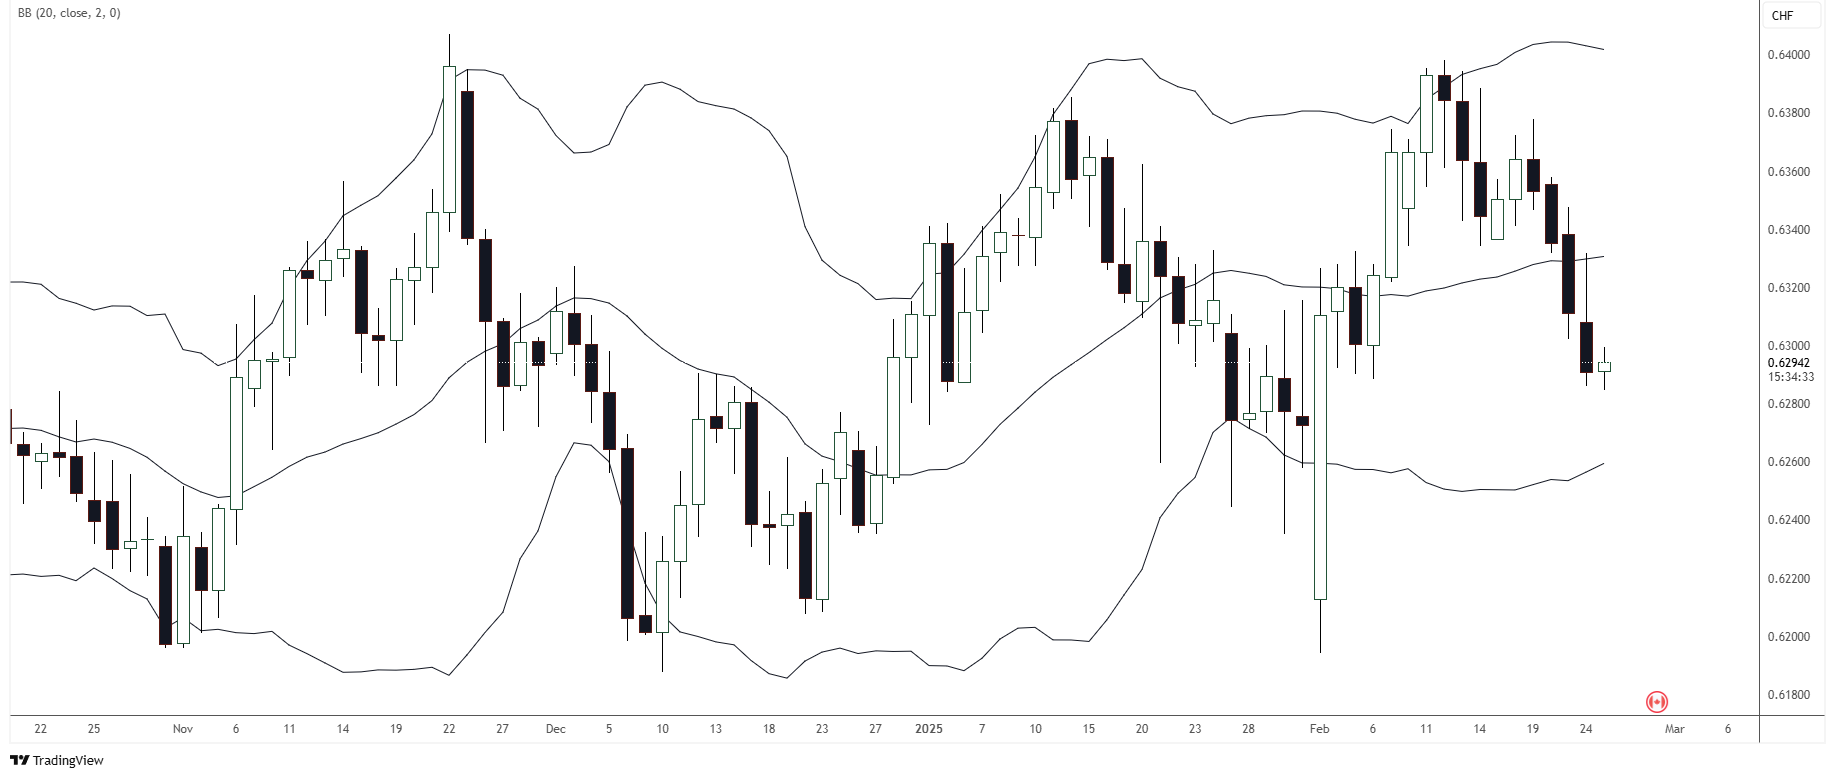
The 3 lines of the Bollinger Bands are plotted directly over price and consists of:
- The Upper Band
- The Middle Line
- The Lower Band
The middle line is normally simple moving average with a period of 20.
The upper and lower bands are calculated using a certain number of standard deviations from the simple moving average; the commonly used standard deviation is 2. This means the upper as well as the lower bands are 2 standard deviations away from the moving average.
In short, the envelope (upper and lower bands) of the Bollinger Bands are a certain distance (standard deviation) away from a mean (moving average).
The standard deviation is what measures the volatility in the sense of how much the price of an asset moves around. As the volatility of an asset increases so does the width of the bands and vice versa for when volatility decreases (bands contract / gets narrower).
Price tends to bounce between the upper and lower bands.
How to Interpret Bollinger Bands:
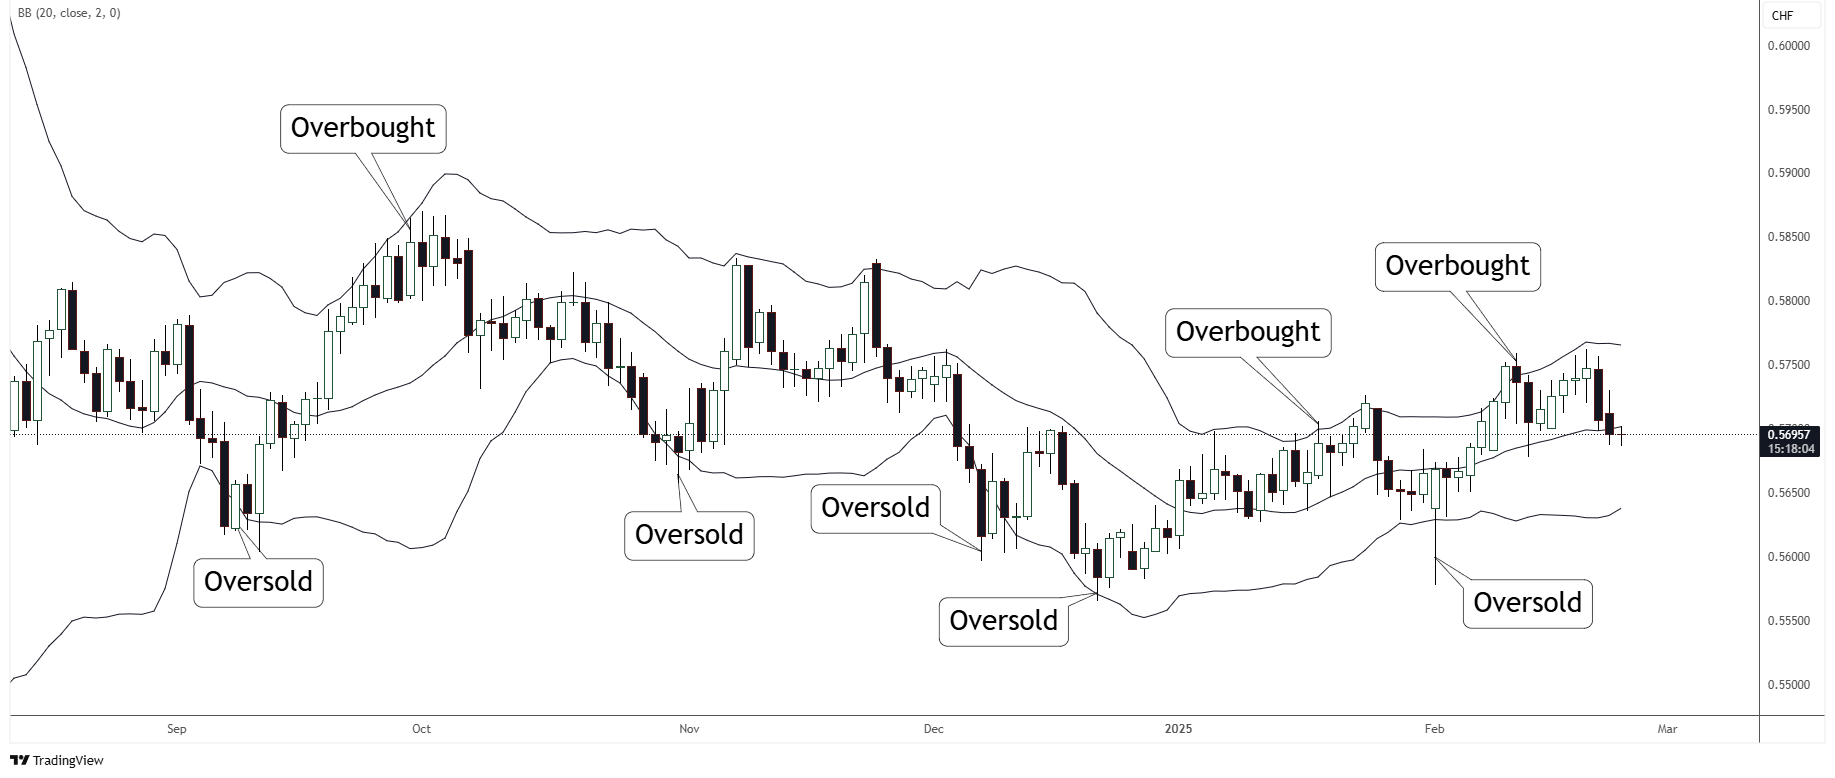
Bollinger Bands using the standard setting of a 20 period simple moving average and 2 standard deviations are designed to incorporate the majority of price movement. With this in mind, Bollinger Bands can be used to identify possible overbought (when prices touches the upper band) and possible oversold conditions (when price touches the lower band).
See chart below:
Its commonly known that after price contraction comes price expansion. Bollinger Bands are a great tool to identify price contractions. This happens when the bands moves closer to each other and price is in a range; often referred to as a squeeze.
When price breaks and closes outside of a band (especially after it contracted / squeezed / volatility decreased), it suggests that a new trend might be starting in the direction of the break (price expansion / volatility increasing).
Persistent price closes beyond, or touches against, a sloping band suggest a powerful trend in the band’s direction.
See chart below:
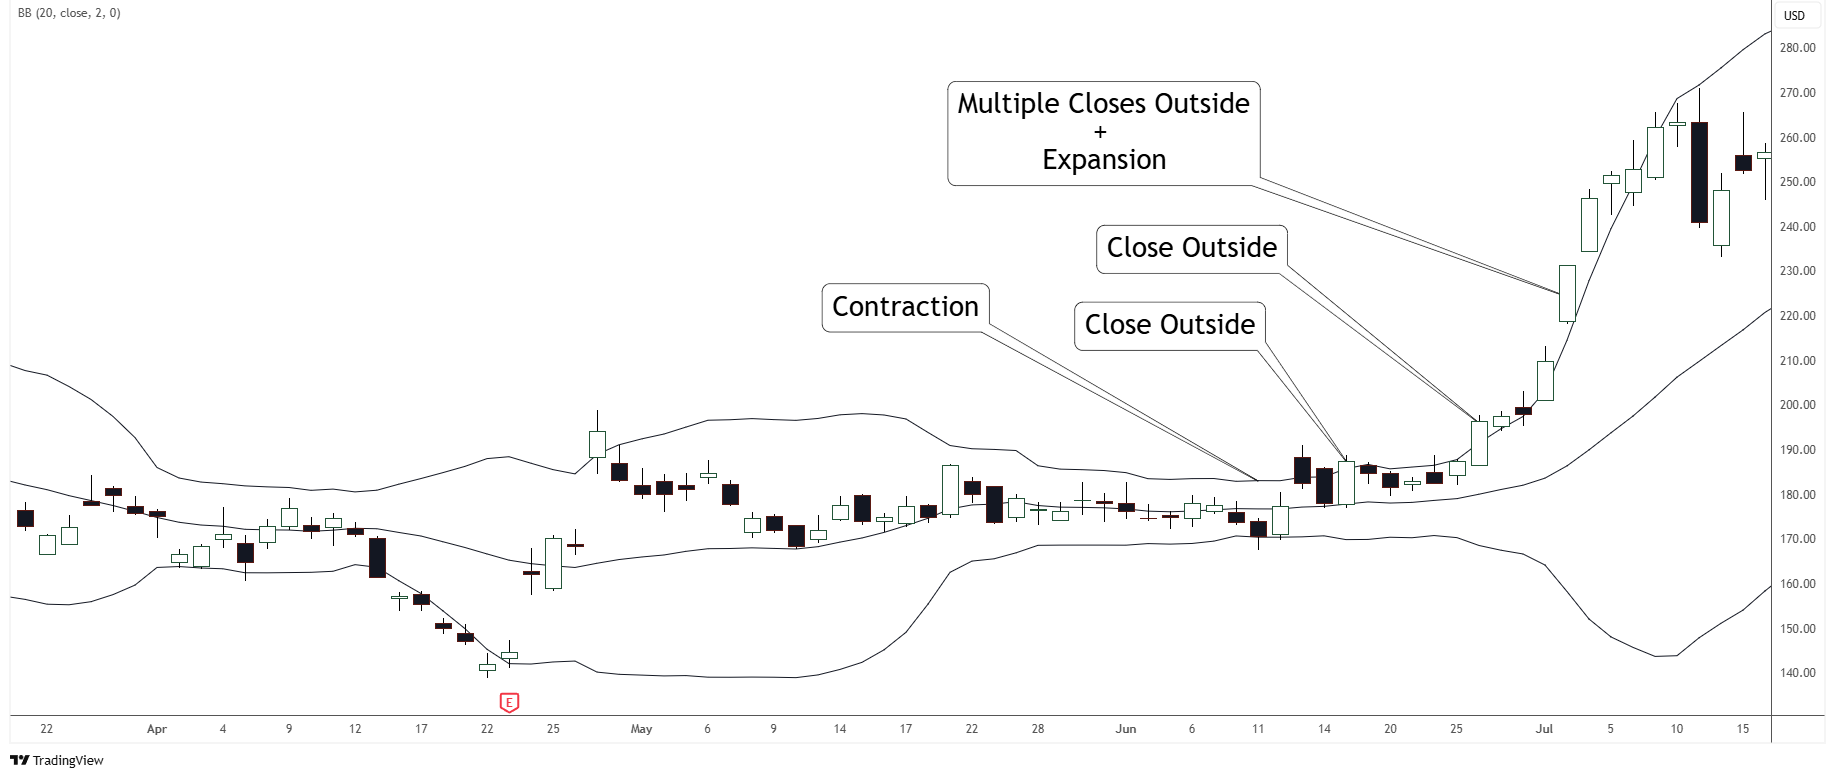
Note: These charts are cherry picked for illustration purposes Not all charts will work this well.
Tips on Using Bollinger Bands:
As with most indicators, it’s not a great idea to use Bollinger Bands as a standalone indicator. Its better to use it with other indicators or price action.
An example is using an indicator such as the RSI to help confirm overbought and oversold conditions. Or use the bands in conjunction with support and resistance levels when its overbought or oversold). Also, it’s never a bad idea to wait for some sort of confirmation like a candlestick pattern before entering a trade.
Changing the Settings of Bollinger Bands:
The settings of Bollinger Bands can be changed.
A shorter term moving average (period less than 20) will be more sensitive to price changes. And a lower standard deviation (less than 2) will cause the bands to be narrower. This makes the indicator more sensitive and might be better for shorter term traders.
A longer term moving average (period more than 20) will be less sensitive to price changes. And a higher standard deviation (more than 2) will cause the bands to be wider. This makes the indicator less sensitive and might be better for longer term traders.
Changing the setting will depend on each traders’ needs.
Finally:
Bollinger Bands can be a very helpful indicator, but just because it is, doesn’t mean you can start using it blindly. Play around with it first to see if it might be a fit for you. Consider doing back testing, or whatever it is you do before you decide to incorporate something into your trading strategy.
Thanks so much for reading this post. Best of luck with your trading.
Trading SOS SOS