Flags and pennants are very popular short term, continuation chart patterns. They are very reliable and many traders trade them exclusively with great success. If you’re interested, please read on.
What are Flags and Pennants?
There are bull flags (you’ll see shortly why its called a bull flag), bear flags, bullish pennants and bearish pennants.
Markets often need to rest during trending periods. These resting periods are called consolidation or congestion periods in technical analysis.
Flags and pennants are short term consolidations that often form during strong trending markets and once price leave the congestive zone, it signals a continuation of the preceding trend. Hence, why it’s called a continuation pattern.
In short, flags and pennants are short term chart patterns beginning with a strong move in price, after which it stalls / rests and then it continues in the same direction.
The bull flag will be discussed in detail next after which all the others will also make sense.
The Bull Flag Pattern:
A bull flag is a bullish chart pattern as the name suggests. It consists of 3 parts: the flagpole, the flag and the breakout from the consolidation area. Please refer to the picture of a bull flag and the discussion that follows for a more in depth explanation of each of the parts.
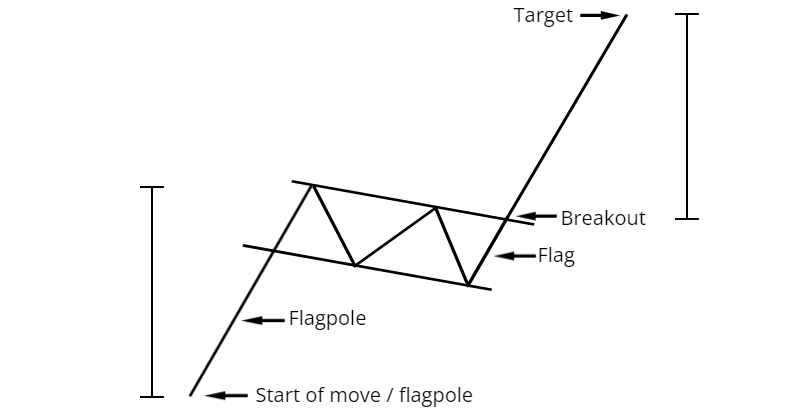
The Flag Pole:
The flagpole is a sharp / steep move that forms part of an uptrend and it normally starts out as a breakout from a big consolidation area.
The Flag:
After the steep advance (flagpole) price starts to consolidate. This happens because some traders take profits, others try to get in on the move and some are waiting to see where price will go next.
The consolidation can go sideways or be slightly downward sloping in a well defined channel (between 2 parallel lines which acts as support and resistance), but shouldn’t be a steep decline. Also, it should be easy to draw the support and resistance lines.
The Breakout:
The signal to enter the bull flag pattern is when price breaks above resistance. This is when traders enter in the hopes that the previous up move is about to resume.
The price target is measured as shown in the figure above, which is the length of the flagpole measured from the breakout point.
Generally, the pattern is seen as a failed pattern if price breaks below the lowest / most recent low (a fair level to place stops) of the flag before the price target is met.
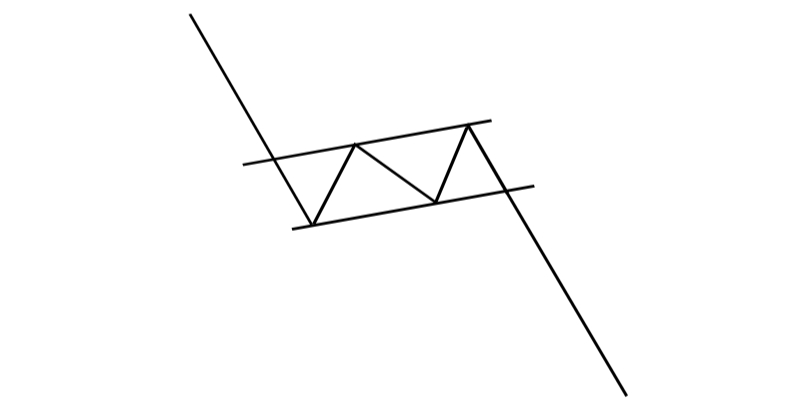
The Bear Flag Pattern:
This pattern is the opposite of the bull flag. You’ll have a sharp move down as part of a downtrend, then a short consolidation and then a break which suggest that the initial move is about to resume. See below:
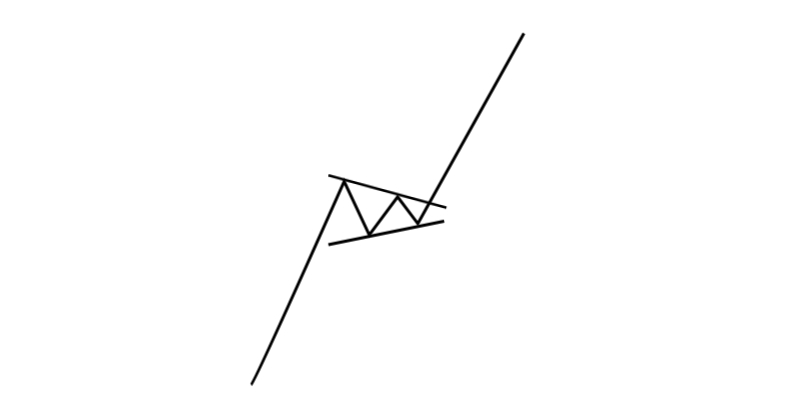
The Bullish Pennant:
The bullish pennant is also a short term bullish continuation pattern and is traded in the same way as a bull flag.
The only difference is that in the case of a flag the price consolidation forms in a well defined channel, but in the case of a pennant the consolidation gets compressed between two converging lines: think small symmetrical triangle. See below:
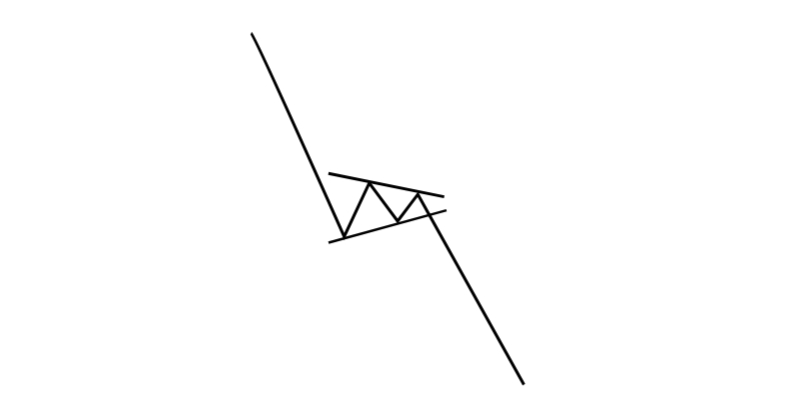
The Bearish Pennant:
The bearish pennant is the opposite of a bullish pennant. See below:
Finally:
Flags and pennants will form in trending markets. I’m sure you’ve heard that it’s best to trade in the direction of the trend, flags and pennants are one of the best ways to do it.
Thanks so much for reading. I hope you found this post useful.
Thanks and Regards,
Trading SOS SOS