This post is an introduction to Japanese candlesticks (also known as candles for short) and will act as a foundation for my future posts on the specific types of candlestick patterns and ideas on how they can be used in trading.
Candlesticks originated in Japan, hence the full name Japanese candlesticks. They became popular in other countries through a book written by Steve Nison named: Japanese Candlestick Charting Techniques. In this book he gives a great description of how he was introduced to candlesticks (candles), the history of how candlestick trading evolved in Japan, and most importantly, Steve does a great job of explaining all the different kinds of candlestick patterns out there and how they can be used. Next we get into the very basics of candlesticks.
Candlestick Construction:
I will explain the construction of candlesticks with the use of the picture below:
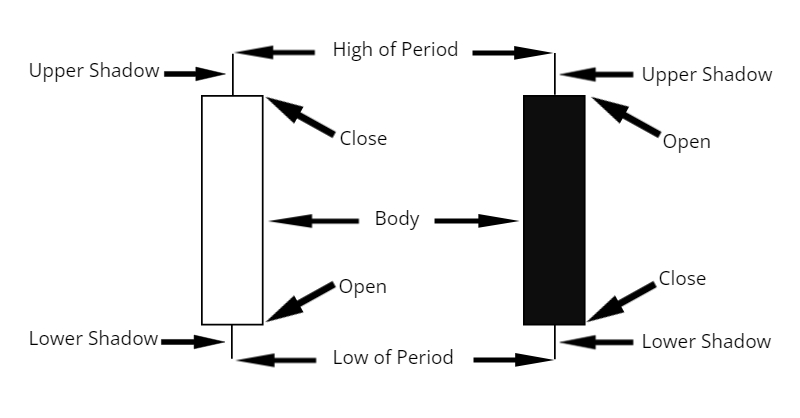
You will find that on the completion of a candlestick for a certain period (hourly, daily, weekly, any except tick), that it is made up of four prices which is the open, close, high and low. The open is the price where the period opened, the close is the price where the period closed and the high and low are the extremes of where price traded during the period. The part between the open and the close is called the real body denoted body in the above picture. The lines above and below the real body are called the upper and lower shadows (also called wicks) of the candle, and depicts the period’s highs (top of upper shadow ) and lows (bottom of lower shadow).
On your trading platform you will find that candlesticks are drawn with two different colors which nowadays can be any of your choosing. The point of the colors is to depict graphically whether price closed above or below the open for the period. In the picture above the white candle shows that price closed above the open and the black candle shows that price closed below the open. So on a chart when using the above color scheme, a trader will automatically know that when a period’s candle is white, price closed up, and when black, price closed down.
Summary of the above:
- Candlesticks are made up of the open (period open), close (period close), high (period high) and low (period low).
- It’s made up of a real body, upper shadow (wick) and lower shadow (wick).
- The real body is the part between the open and the close.
- The upper shadow (wick) is the line above the real body with the top being the periods’ high.
- The lower shadow (wick) is the line below the real body and is the period’s low.
- Candles come in two different colors.
- When close > open it’s one colour (white in case of above picture).
- When close < open it’s another color (black in case of above picture).
How Candlesticks vary:
The real bodies of candles can vary in length depending on where the price opened and closed for the period. The shadows will also vary in length depending on the high and low of the period of the candle. The two different colors also makes it easy to see how prices closed during a period. Because of how the size and colors of the real bodies, and the lengths of the shadows can change during each period a new candle is formed, candlesticks can tell a story of what prices are doing and may do during trading sessions; candles make it visually easier to read charts for many traders because of this.
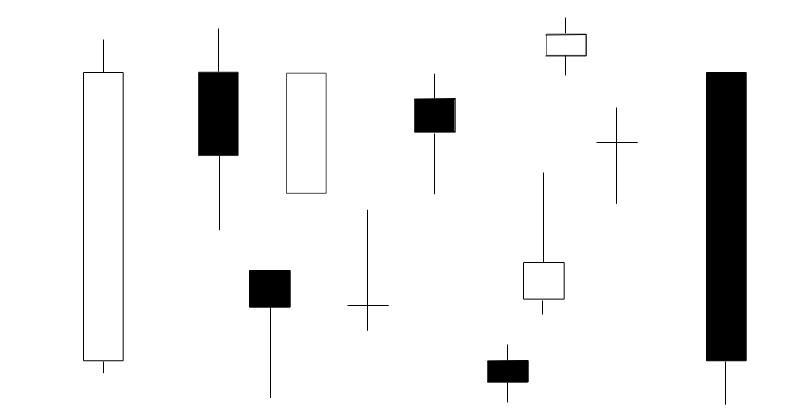
Look at the picture below to get some idea as to the different ways in which candles can appear on a chart. The types of candles below are by no means a conclusive representation of the many out there, but it should at least give you some idea as of what to expect on a candlestick chart.

Finally:
The shape, size and length of the shadows of a candle can give an indication as to where price might go next… these are also used to name different candles. Candlesticks – when used correctly – can be powerful, but more on that in future posts.
Thanks so much for reading.
Thanks and Regards,
Trading SOS SOS