One of the most common indicators used in technical analysis is the moving average.
What is a Moving Average?
It is the average price of the instrument you are trading over a defined period and is mostly used to smooth out price fluctuations so that the trend is more clear. When overlaid on a price chart, it can act as a guide on where price is and where price might go.
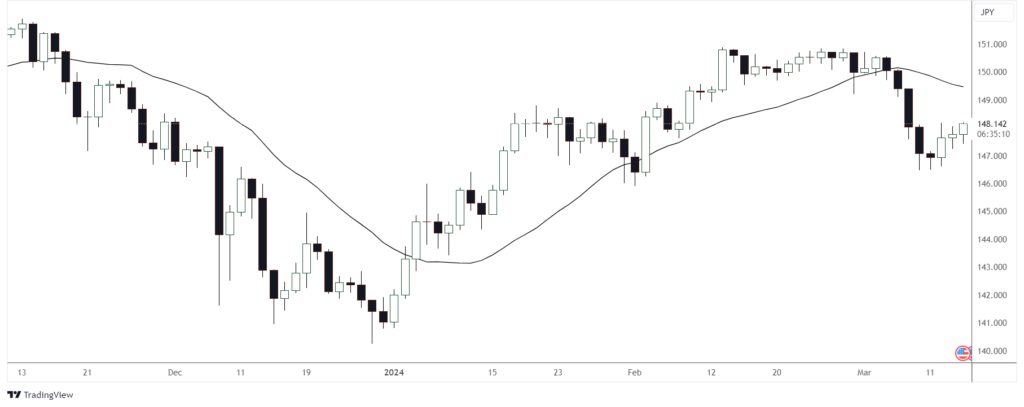
Below is a daily candlestick chart of USDJPY with a 20 day moving average (solid black line) overlay:
How a Moving Average is Calculated:
To make the explanation easier, I will discuss the simple moving average (there are other types which is discussed later). Moving averages come in different lengths (time periods used to calculate it). For example, a 5 – day simple moving average is calculated by adding the closing prices of the past 5 trading days and dividing it by 5 (the average closing price of the last 5 days ). And each successive day a new average closing price is calculated (average price of 5 most recent trading days)… hence, moving average.
Different Types of Moving Averages:
Other than simple moving averages, there are also the weighted and exponential moving averages.
Moving averages are lagging indicators (it lags price), so with the weighted and exponential moving averages more weight assigned to more recent price data and less weight to older price data. This is done to to reduce the lag between price and the average.
I’m not going to get into the details of the calculation between the weighted and exponential moving averages; I can say that the exponential reacts even faster than the weighted because how it is calculated.
Different Lengths of Moving Averages:
The 5 to 20 period moving averages are generally regarded as short term moving averages, between 30 and 100 as medium term and those from 100 upwards are regarded as long term moving averages.
Moving averages with a short time period will react faster to price than those with a longer time period.
Popular moving averages are the 5, 10 and 20/21 period moving averages for short term. On the medium term side the 30, 50 and 60 period moving averages are quite popular. And on the longer term side popular moving averages are the 100, 150 and 200 period moving averages.
Most Common Uses of the Moving Average:
Moving averages removes the noise of price which help to identify trends. When price is rising, its usually above the moving average, indicating an uptrend…and vice versa for when price is falling. It’s a great indicator to filter price into uptrends and downtrends.
They are a great to tool to use as entry tactics / signals and many mechanical / systematic traders use them as a part of their trading strategies / systems.
Another way to get entry signals or identify price trends is by using moving average crossovers (where a shorter term moving averages crosses a longer term one).
Popular moving averages are also used as areas of interest, meaning traders use them to trade off of during pullbacks in an uptrend (buying) and rallies in a downtrend (shorting). This is why it is sometimes referred to as dynamic support and resistance.
Another use of moving averages is to use them as trailing stops, meaning that the average guides the trader as to how long to stay in trade.
Finally:
In the end it’s up to you, the trader, to choose which moving average to use.
For example, many traders like the 10 period moving average for short term trend identification, but there are others that prefer to use the 8 or 9 period instead. Some traders prefer simple moving averages and others the weighted or exponential.
If you decide to use moving averages, settling on your favorite moving averages will come over time by playing with different ones and back testing.
Thanks so much for reading. I hope you found this post useful.
Thanks and Regards,
Trading SOS SOS