Support and resistance is very popular when it comes to trading, so in this post I will explain the very basics of support and resistance.
First I want to touch on the concept of trend. In general a market will either move upward – it is in an uptrend, downward – it is in a downtrend or sideways – there is no trend.
You need to understand that markets don’t move in a straight line but rather in zigs and zags forming peaks and troughs. When a market is in an uptrend, the peaks and toughs would move higher. When in a downtrend, the peaks and troughs will move lower. And when there is no clear trend the market is moving sideways. In the next section I’m getting into support and resistance and I’ll have some illustrations showing the different trends.
When price is moving down and there is a reaction to that down movement in price (forms a trough), that turning point is called support. And when price moves up and turns down (forms a peak), that turning point is called resistance.
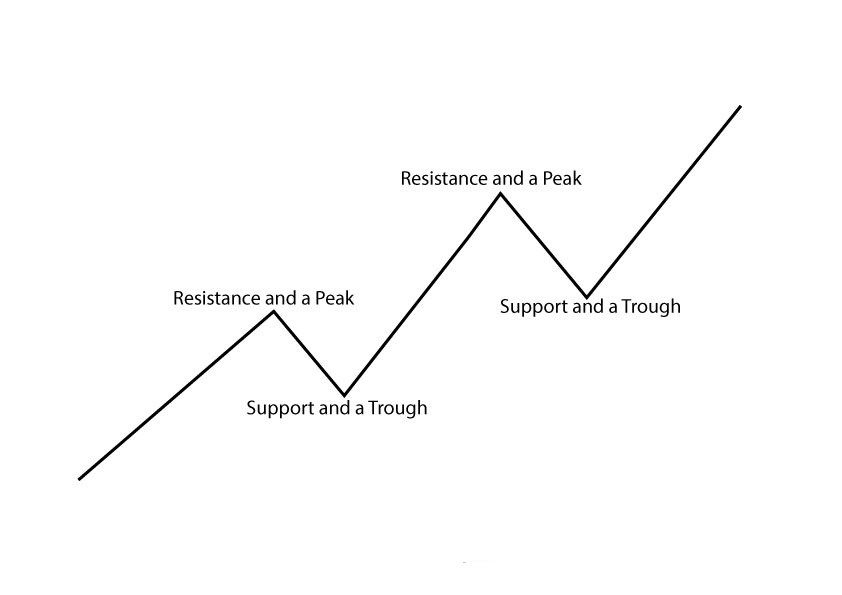
The picture below shows an uptrend with support and resistance on it:
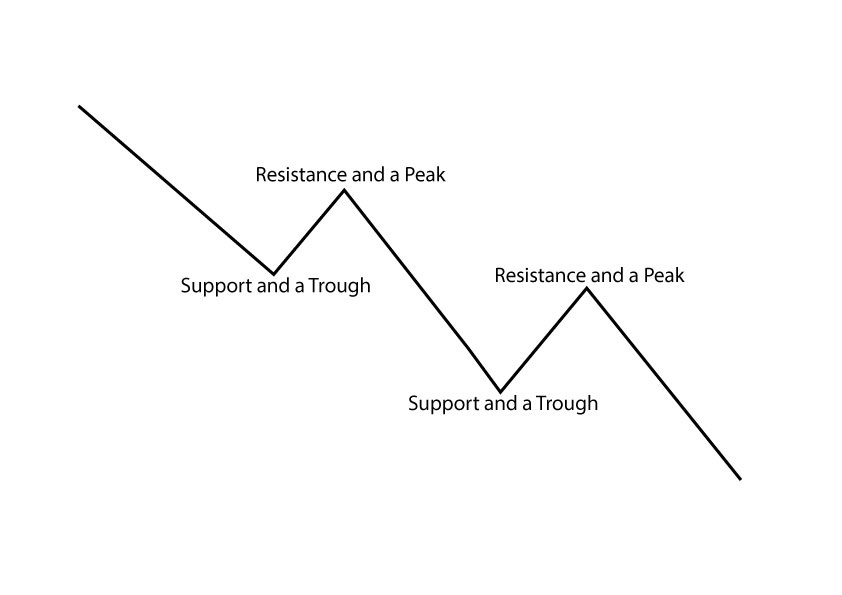
Next is a picture of a downtrend also with support, resistance, peaks and troughs labeled. Here you can see the peaks and troughs are moving lower:
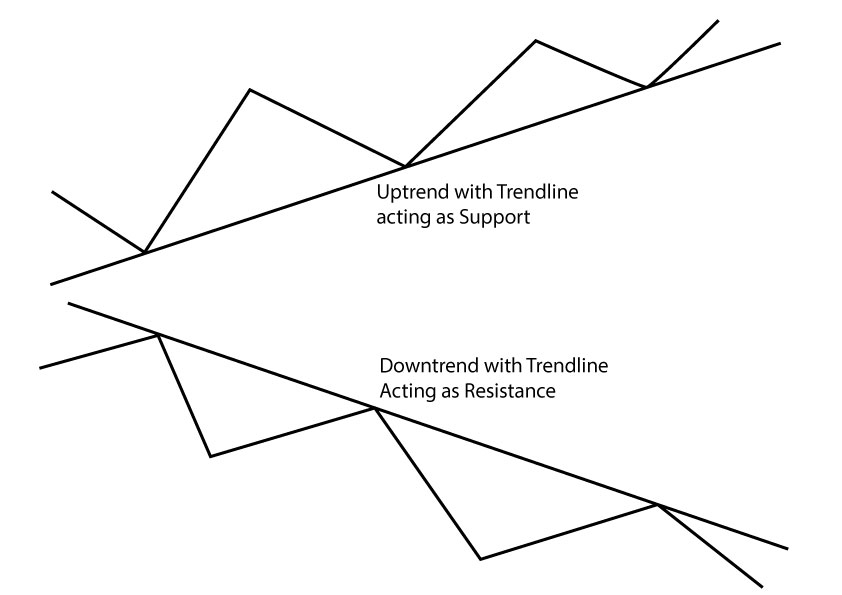
A line drawn and extended across two successive rising troughs is called a trendline and can act as support in an uptrend. And a line drawn across two successive peaks is a trendline which can act as resistance in a downtrend. This is what is shown in the next picture:
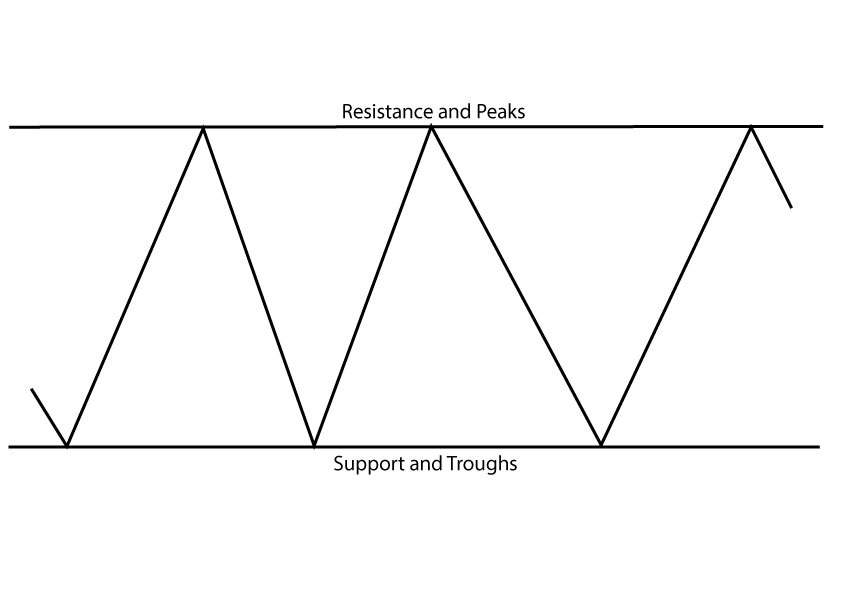
What follows next is a picture of a sideways trend. Here you can see peaks and troughs are almost horizontal so the support and resistance lines are drawn at the same level. Please note that a sideways / trendless market is not always so clear cut:
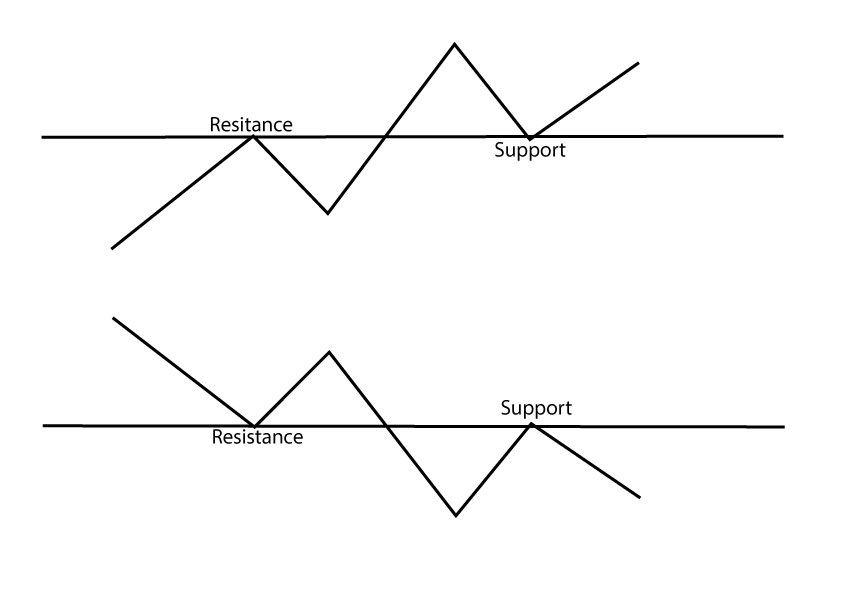
When support is broken it tends to act as resistance when there is a subsequent bounce. This is because the people who were long at support and did not sell on the first break of support now has a second chance to close their longs at breakeven and those people that did not sell short on the first break has another chance to sell short, thus turning that support level into resistance.
When resistance is broken it tends to act as support on subsequent corrections. This is because the people that were short at that resistance and did not close out their trade at the time resistance were broken now has another chance on the correction to close out the trade for breakeven and those that did not go long on the initial break now have a second chance to go long (buy) and hence, resistance turns into support.
This was a very basic explanation and I hope you get the gist of it. The following picture will also help (only horizontal support / resistance is shown below but the same applies to trendlines):
In technical analysis traders look at support and resistance levels as areas where they can trade around. I use the term traders in this post because I’m a trader… but the same can be said of investors using technical analysis, they would just have a much longer time horizon. So in short:
- In an uptrend traders can look to buy at or close to the upsloping trendline (buy support).
- In a downtrend traders can look to sell at or close to the downsloping trendline (sell resistance).
- When there is a sideways consolidation traders can look to buy at or close to support and sell at or close to resistance.
- When support breaks traders can look to sell at or close to that previous support which should now act as resistance.
- When resistance breaks traders look to buy at or close to that previous resistance which should now act as support.
- Support and resistance can also be used as profit taking levels (this could be a whole new post so I will leave it here for now).
Thanks so much for reading.
Kind Regards,
Trading SOS SOS