In this post I will explain the ascending and descending triangle as chart patterns being used by many traders as part of their trading arsenal. These patterns are very popular in the realm of technical analysis and can be either of the continuation or reversal type as you will see shortly.
Ascending and Descending Triangles as Continuation Patterns:
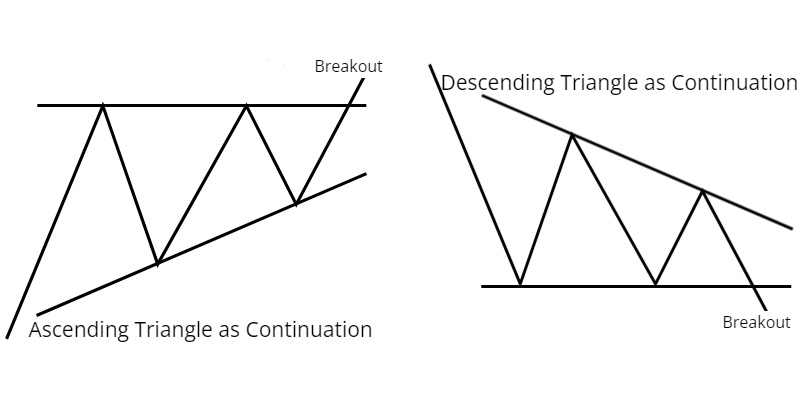
In both the ascending and descending triangle price trades in a narrower and narrower range, building up “pressure” (also known as coiling) before it breaks out.
In an ascending triangle price is bounded by a horizontal line (resistance) which can be drawn across successive peaks (forming at the same level) and a minor uptrend line (support) which can be drawn across successive rising bottoms.
In a descending triangle price is bounded by a horizontal line (support) which can be drawn across successive bottoms (forming at the same level) and a minor downtrend line (resistance) which can be drawn across successive declining peaks.
The picture below shows an example of an ascending triangle as a continuation in an uptrend and a descending triangle as a continuation in a downtrend:
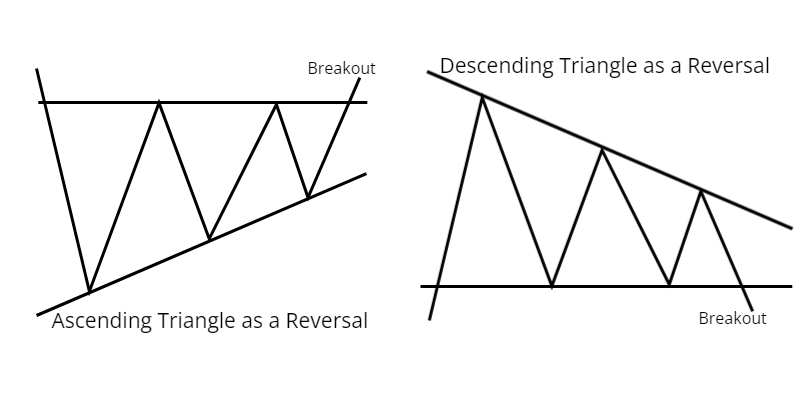
Ascending and Descending Triangles as Reversal Patterns:
Both triangles (ascending and descending) can be reversal patterns. See see picture below for how a ascending triangle reverses a downtrend, and how a descending triangle reverses an uptrend:
Breakouts:
Breakouts of the horizontal boundary are favored in both triangles because of the way in which price trades within the triangles. In an ascending triangle buyers step in sooner every time, indicated by the rising bottoms and while sellers are defending the same resistance (horizontal line), indicating that buyers are more aggressive and an upside breakout is more likely. In a descending triangle sellers step in sooner and sooner every time, indicated by the lower peaks while the buyers are defending the same support (horizontal line), indicating that the sellers are more aggressive than the buyers and that a downside breakout is more likely.
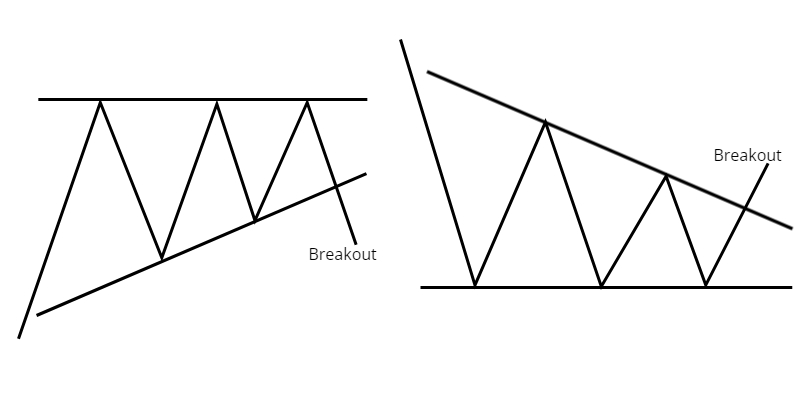
The above does not mean that traders only trade a break of the horizontal boundary. Many traders also trade breaks of the rising trendline of the ascending triangle and declining trendline of the descending triangle. It really comes down to the preferences of each trader. See picture below:
What about Targets?
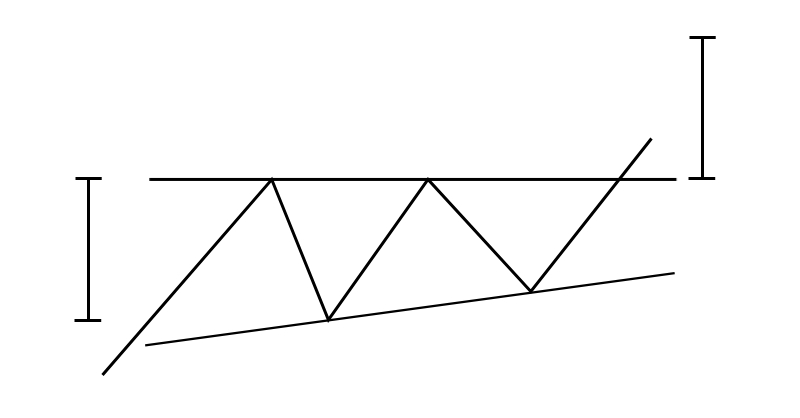
To get a minimum price target for the ascending / descending triangle, measure the height at the base of the triangle and project this length from the breakout point of the triangle. Shown below is an example for an ascending triangle:
Some traders enter on the breakout, others wait for a retest of the support / resistance line after the break to enter, but then risk missing the trade (if there is no retest) and then some traders will do both – that is enter a position on initial break and add a second position on the retest. There are other ways to enter but I just wanted to give you an idea of what can be done.
Finally:
Remember that in technical analysis chart patterns – no matter how powerful – don’t always play out 100 % always; they can and do fail. The ascending and descending triangle – even though they are very popular – are no exception.
Thanks so much for reading, hope you enjoyed this post.
Thanks and Regards,
Trading SOS SOS
1 Comment.
[…] Thank you so much for reading. Hope you enjoyed this post. I also cover the ascending and descending triangle here. […]