The Average Directional Index (ADX) was created by J. Welles Wilder, and is explained fully in his book, New Concepts in Technical Trading Systems. I suggest that if you haven’t already, you read about the DMI first because the ADX is derived from it.
The Average Directional Index (ADX):
What is the ADX?
As mentioned above, the ADX is derived from the DMI (+DI and -DI). Whereas the DMI is used the determine the direction of a trend, the ADX is used to measure the strength of a trend.
Note: The ADX measures the strength of a trend, not the direction.
The ADX is calculated by:
- Calculating the True Range (TR), which is a measure of how much price has moved in a specified period. Putting it simply, its purpose is to capture the true extent of a price swing. The TR is then smoothed to get the Average True Range (ATR).
- Calculating the +DM and -DM (these are raw values, not +DI and -DI) and smoothing them.
- Use smoothed +DM, -DM and ATR to calculate +DI and -DI.
- Use +DI and -DI to calculate the Directional Index (DX).
- Smooth DX to get ADX.
The ADX ranges from 0 to 100. The default period setting on most trading platforms for the DMI is 14, Wilder also recommended this.
How does It Work?
I have to mention again, the ADX measures trend strength and not trend direction. Another indicator, such as the DMI, can be used to determine trend direction. With that out of the way, here are the main ways to interpret the ADX:
- A rising ADX indicates the the trend is strengthening.
- A falling ADX indicates the trend getting weaker / ranging.
- ADX values between 0 and 20 indicates a weak or no trend (many suggest using 25 instead of 20 here).
- ADX values between 20 and 50 suggests a strong trend (again many uses 25 instead of 20 here).
- ADX values above 50 suggests a very strong trend.
See chart below:
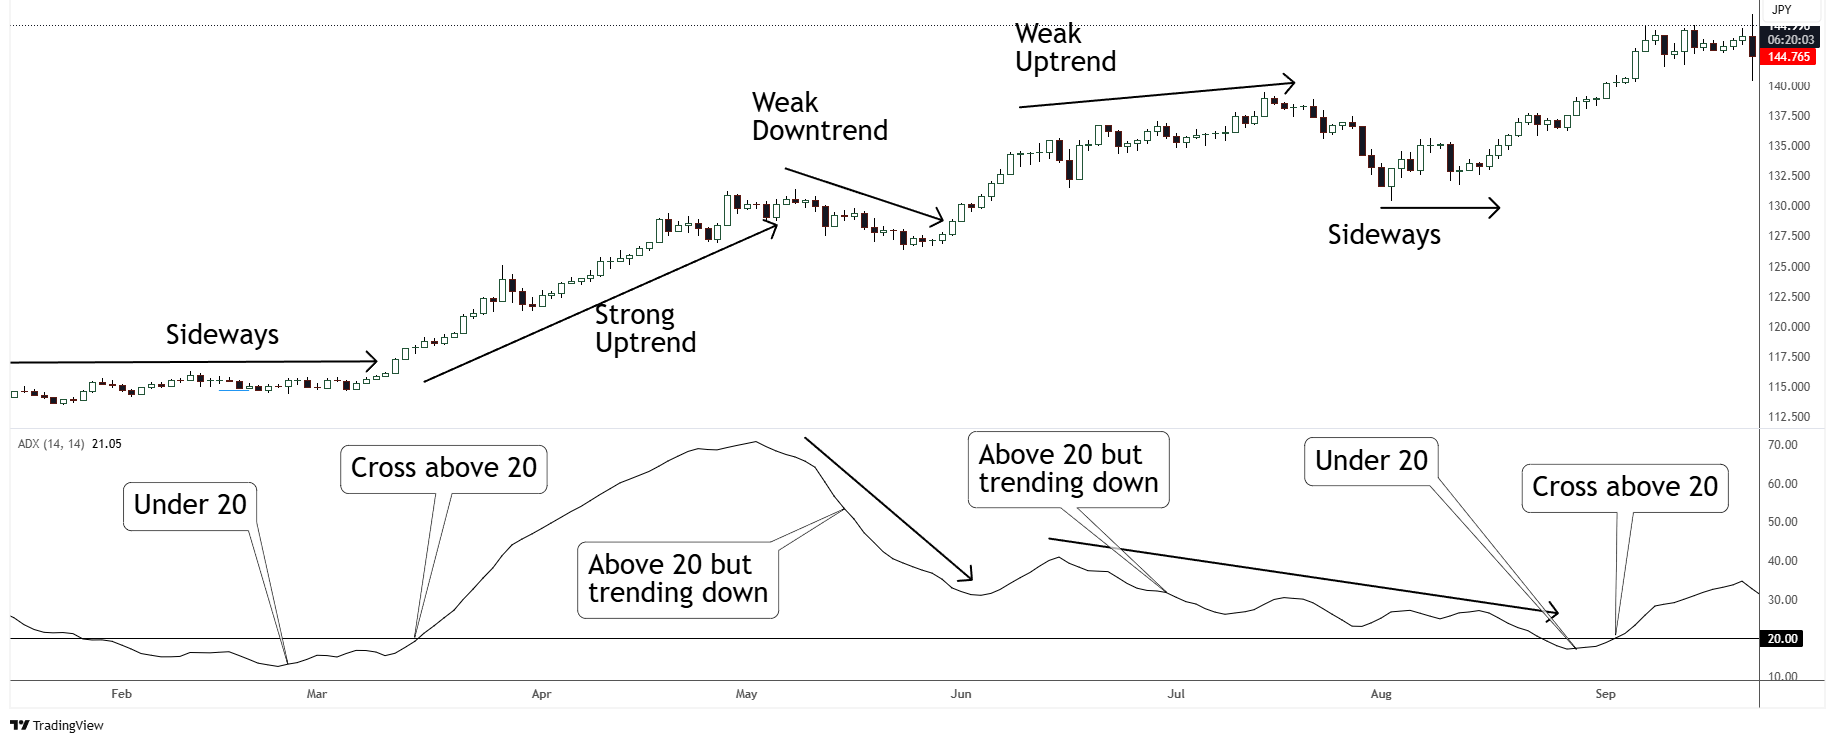
Many traders use the ADX (to determine trend strength) in conjunction with the DMI (for trend direction and buy / sell signals).
Please note that the above chart was cherry picked for explanation purposes. In real trading charts will not always set up as nicely. As with all indicators, it is best for the trader to study and pick what works best for him / her.
Finally:
The ADX (just like the moving average) is a great indicator to signal when a new trend might be starting. When it does, its best to go with the trend, not against it. When it signals the absence of a trend, it might be better to employ countertrend strategies.
Thank you for taking time to read this post. I trust you’ll find this useful. All the best with your trading.
Thanks and Regards,
Trading SOS SOS