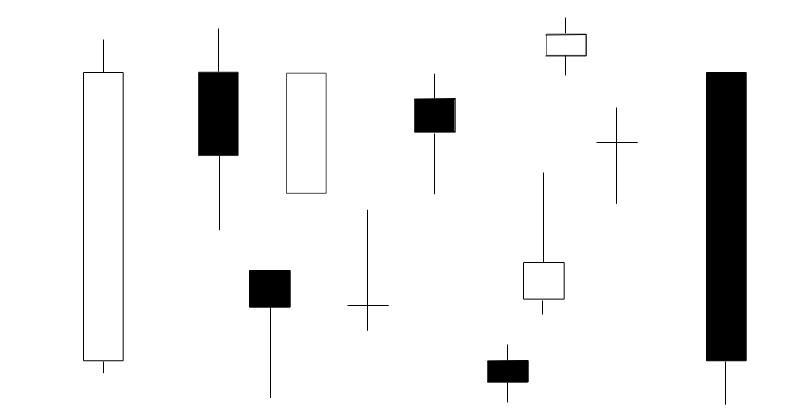
The Average True Range (ATR) is a technical indicator that was created by J. Welles Wilder and is explained in his book, New Concepts in Technical Trading Systems.
The Average True Range (ATR):
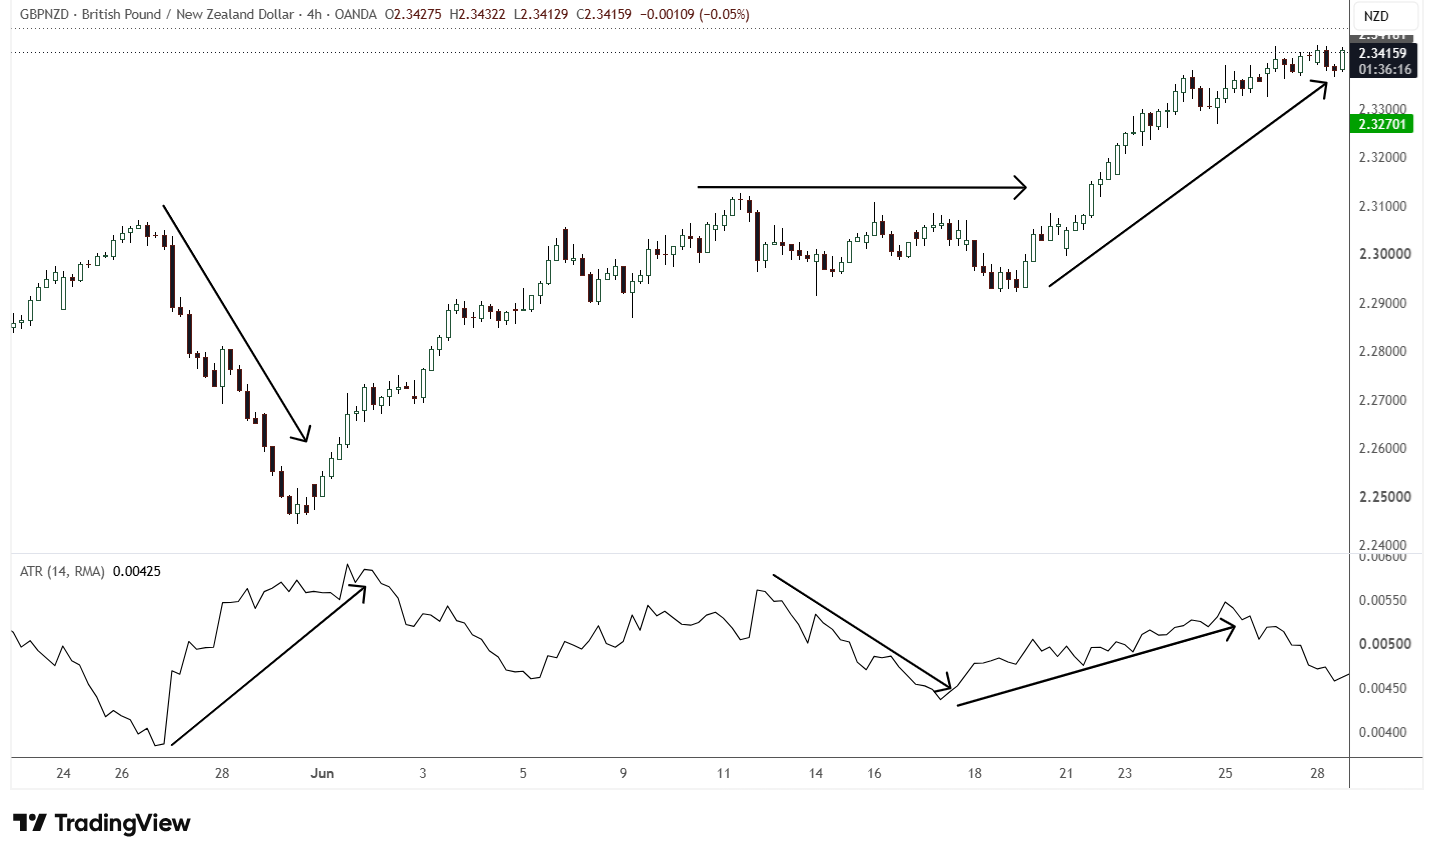
The ATR is a technical indicator that’s normally placed on a separate panel at the bottom of a chart. It measures the volatility of an asset. When the ATR is increasing (rising), it means that price is getting more volatile. When the ATR is decreasing (falling), it means that volatility is decreasing.
Calculating the ATR:
In order to calculate the ATR, the True Range is needed first. Three different distances are used to get the True Range:
- Distance 1: Current Candle’s High to Current Candle’s Low.
- Distance 2: Previous Candle’s Close to Current Candle’s High.
- Distance 3: Previous Candle’s Close to Current Candle’s Low.
Whichever of the above three numbers is the largest becomes Candle’s True Range.
To get the Average True Range, you take these True Range values over a specific period and calculate their average. As with most of Wilder’s indicators, he suggests using a period of 14.
Also, using a period less than 14 makes the ATR more sensitive to price movement, and using a period of more than 14 makes the ATR less sensitive to price movement.
The formula is smoothed out so that erratic and big price movements don’t have a big impact on the average, and recent price moves still count the most.
Reading and Trading with the ATR:
The ATR is measured in the price of an asset, for example Dollars in the case of US stocks, Pips in the case of Forex, etc.
Again, a rising ATR suggests that volatility is increasing and that the trend might be strengthening, while a decreasing ATR suggests volatility is decreasing and the trend might be weakening (ranging).
Note: The direction of the ATR doesn’t say anything about the direction of the trend.
See below:
Ways of using the ATR:
- It is a great tool for placing stops. Many traders use a multiple of the ATR (like 2x ATR) from their entry point. This helps prevent getting stopped out by random market noise.
- Building on the above, it is a great tool for trail stops in order to lock in profits as the price of an asset moves in the favor of a trader.
- It can also be used to set profit targets based on current market volatility, making the targets more realistic.
- Based on the concept that periods of low volatility are followed by periods of high volatility, traders can use the ATR to predict changes in price (from ranging to trending and vice versa).
Finally:
Test and study each and every indicator to make sure they resonate with you and your style of trading before you start implementing them. Also, try to keep things simple… using too many indicators can lead to confusion.
Thanks so much for reading. I hope that your trading is treating you well. Good luck
Thanks and Regards,
Trading SOS SOS