In this post I cover the Cup and Handle chart pattern. This pattern is very popular among technical traders, especially those that swing trade stocks. Sounds good? Please read on.
The Cup and Handle:
The Cup and Handle pattern forms as part of a correction / basing pattern after an established uptrend. Hence, it can be seen as a bullish continuation pattern which can be used to find buying opportunities.
As the name suggests, the pattern consists of 2 parts:
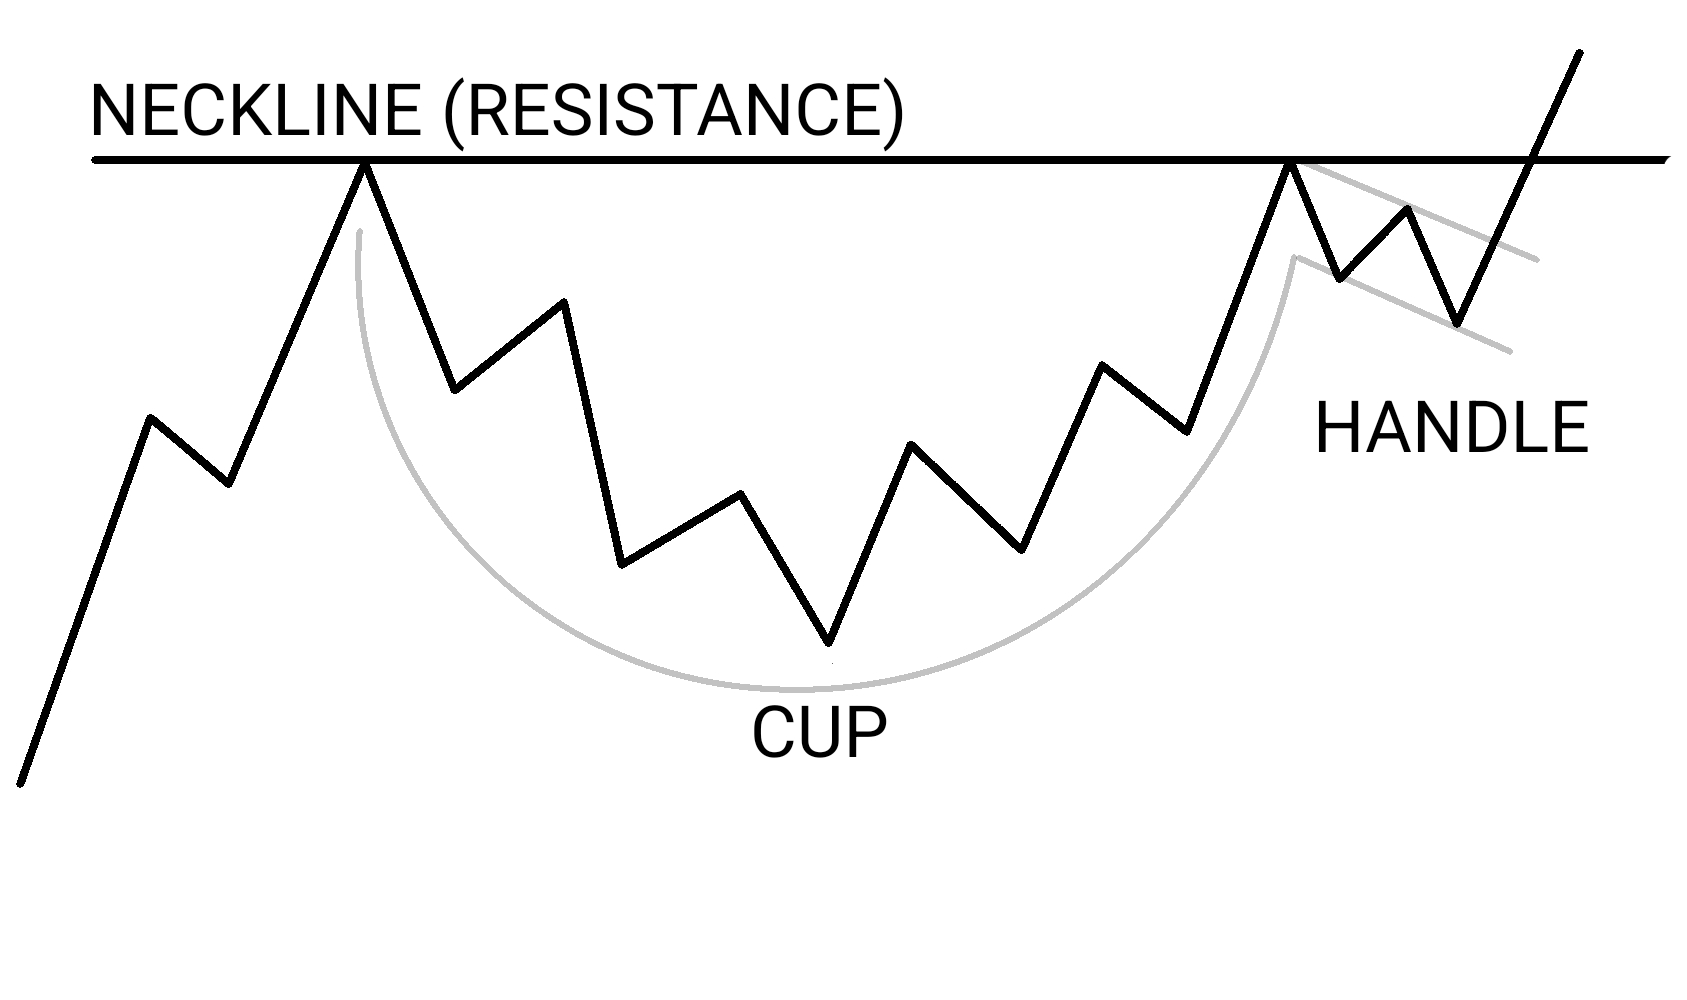
- The Cup: A U-shaped / bowl-like formation that forms after an uptrend. This means price retraces from its prior high, then moves back to retest said high in a smooth, rounding manner – this is the first part of the consolidation / correction / base. Also, the retest of the prior high doesn’t have to be perfect and to the tee, but the closer the better.
- The Handle: A brief, sideways / slightly down-sloping consolidation after the cup formed. Brief, meaning the consolidation of the handle is smaller and forms faster than that of the cup. Think flag or pennant.
Ideally, as with all patterns, the Cup and Handle should stand out on a chart.
Trades are taken on breakouts, which can happen in one of two ways:
- A breakout from the Handle, which is earlier and a little more aggressive.
- A breakout from the neckline, which is later and a little more conservative.
See picture below:
What about Targets?
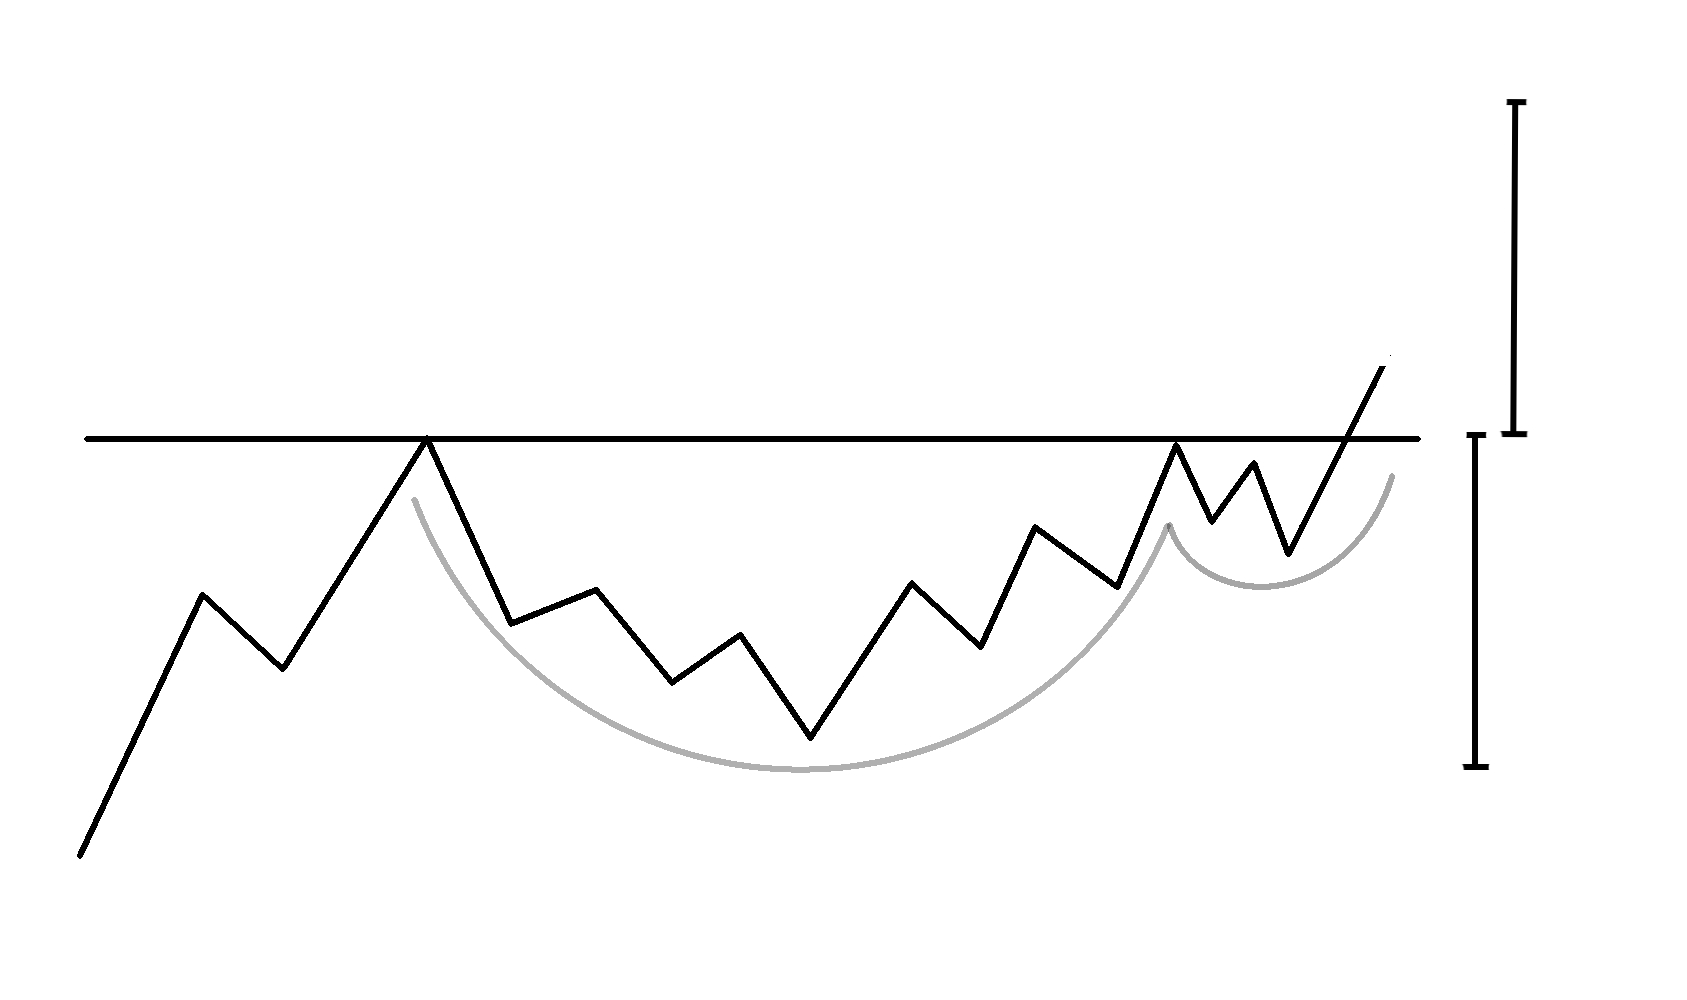
A price target can be obtained by measuring the depth of the Cup – the distance from the bottom of the Cup up to the first high (where the consolidation started) – and projecting that upwards from the breakout point. This serves as a minimum price target.
In the case of the Cup and Handle, the target is subjective as it can measured either from the breakout of the neckline or the Handle, depending on where the trader trades the breakout from.
See picture below (measured from a breakout from the neckline):
Tidbits on the Cup and Handle:
The late William J. O’Neil is widely credited with this pattern. It was introduced and popularized in his book How to Make Money in Stocks. Other things of note are:
- The Cup should have a rounded bowl shape, not a sharp “V-like” shape and most of them forms over a period of 3 to 6 months.
- Ideally, the depth of the Cup should be between 12% – 33% of the prior advance. In some cases, like when volatility is high, retracements can be deeper..
- The Handle should take at least 1 to 2 weeks to form. Ideally, it should not drop more than 8% – 12% of the Cup’s high and should not drop more than 50% of the depth of the Cup.
- Volume should decrease as the Cup and the Handle forms and should drop to a minimum at the bottom of the Cup and during the formation of the Handle.
- Volume must increase notably during the breakout.
Finally:
Remember, that in technical analysis chart patterns don’t always play out 100 % – they can and do fail. The Cup and Handle is no exception.
Thank you for reading. I hope you enjoyed this post. All the bet with your trading.
Thanks and Regards,
Trading SOS SOS