In this post I will be covering the double top and double bottom pattern; classic chart patterns in technical analysis known as reversal patterns. Before I get into this post I want those of you that want to know what technical analysis is to check this post out, and for those that need to know more about support and resistance can read about it here; both posts will make what I’m about to discuss a lot more clear.
The Double Top and Double Bottom:
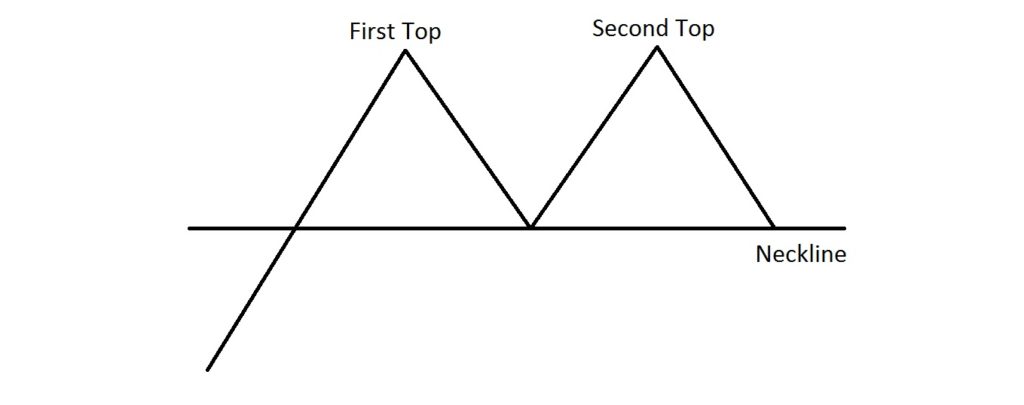
Please refer to the picture below for the explanation of a double top that follows. A double top resembles the letter “M”. In an uptrend (making higher highs and higher lows), the first top is formed as part of the rising trend making a higher high then retraces to make a low (nothing to indicate a change in trend). Then price bounces to (or very close to) the level of the first / prior top; encountering resistance (at high of first top) and so starting to form the second top. Also, there is now a support level at the aforementioned low. Prices then retrace back to this support level which is called the neckline. Only when this neckline is broken to the downside (price closes below it) is the double top complete and a reversal is signaled.
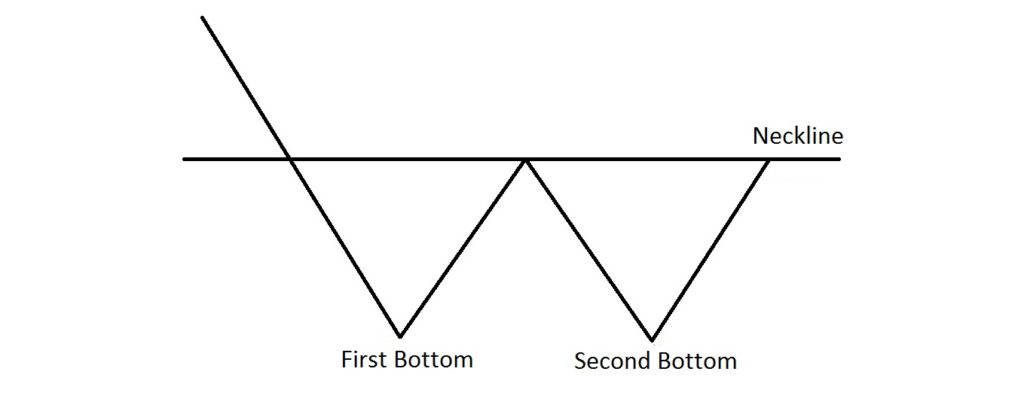
Please refer to the picture that follows for an explanation of a double bottom. A double bottom resembles the letter “W”. In a downtrend (making lower highs and lower lows), the first bottom is formed as part of the downtrend making a lower low then bounces to make a high (nothing to indicate a change in trend). The low of the first bottom is also a support level. Price then falls to (or very close to) the level of the first / prior bottom (support level); and so starts to form the second bottom. The aforementioned high is now a resistance level. Price then moves back up to the resistance level which is called the neckline. Only when this neckline is broken to the upside (price closes above it) is the double top complete and a reversal is signalled.
What about Targets?
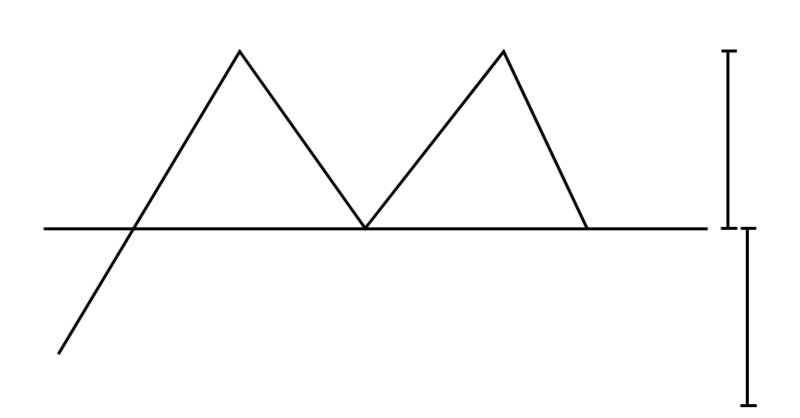
In order to establish price targets for the double top and bottom, measure the vertical distance between the top and the neckline in the case of a double top; or in case of a double bottom, measure the vertical distance between the bottom and the neckline. Project this distance down from the neckline in case of a double top and up from the neckline in case of double bottom.. This will be your minimum target. See picture below of an example in case of a double top:
How to Trade it?
Some traders enter on the break of the neckline (support / resistance), others wait for a retest of the neckline (support / resistance) to enter but then risk missing the trade (if there is no retest) and then some traders will do both – that is enter a position on initial break and add a second position on the retest. There are other ways to enter but I just wanted to give you an idea of what can be done.
Finally:
Remember that in technical analysis chart patterns – no matter how powerful – don’t always play out 100 % always; they can and do fail. The double top and bottom patterns – even though they are very popular – are no exception.
Thanks so much for reading. Hope you and the family are safe.
Thanks and Regards,
Trading SOS SOS