In this post I will be discussing one of the most well known and widely recognized patterns in classical charting known as the head and shoulders pattern. It is mainly known as a reversal pattern but some technical analysts also use it as a continuation pattern so I will be discussing both here.
Before I get further into this post I just want to mention that if you want to know more about what technical analysis is, you can check this post out, and for those that need to know more about support and resistance can read about it here. The reason for mentioning it here will become more clear as you read through this post.
The Head and Shoulders (Top and Bottom):
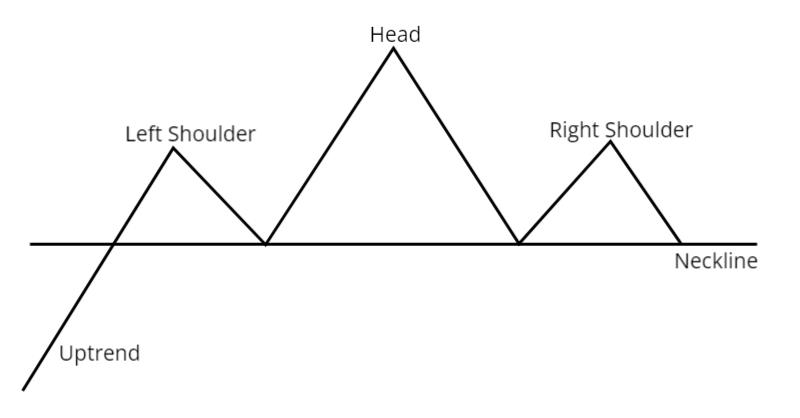
As you will shortly see, the head and shoulders pattern is so named because of its resemblance of a head with two shoulders. Please refer to the picture below for the explanation of a head and shoulders top that follows. In an uptrend (making higher highs and higher lows), the left shoulder forms part of the rising trend. After the left shoulder is formed prices move higher again and make another new high, but then prices fall back to the previous low which is called the neckline. This move making the new high and then retracing to the neckline is called the head. The right shoulder forms when price rises again, but then fails to make a new high (higher high) or to even move back up to at least the high of the head, but instead falls back to the neckline. Only when the neckline is broken to the downside is the pattern complete and signals a reversal (completes the head and shoulders top) .
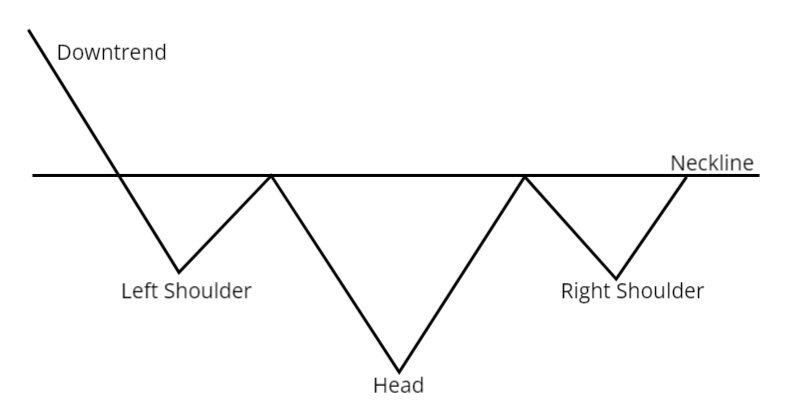
Please refer to the picture below for the explanation of a head and shoulders bottom / inverse head and shoulders that follows. Price is in a downtrend and the left shoulder forms as a part of this trend. After the left shoulder is formed, prices move lower again making a new low, but then prices move back up to the previous high which is the neckline. This move making a new low then moving to the neckline is called the head. The right shoulder forms when price moves lower again but fails to make a new low or to even move back to the previous low of the head, but instead reverses back to the neckline. Only when the neckline is broken to the upside is the pattern complete and signals a reversal (completes the head and shoulders bottom).
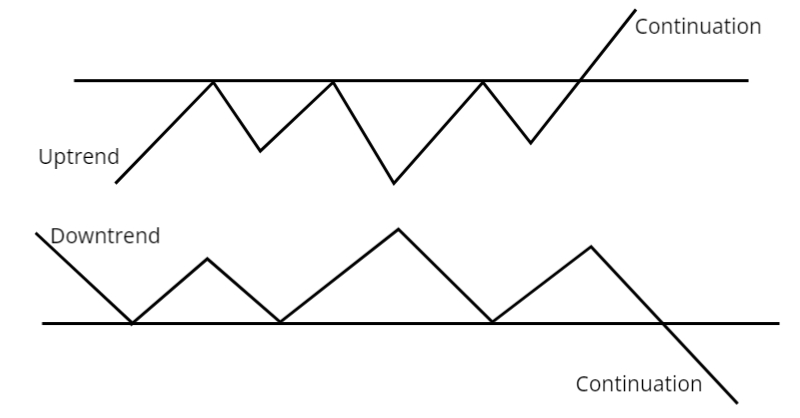
Continuation Head and Shoulders Patterns:
When an inverse head and shoulders forms during an uptrend, a break of the neckline is seen of a continuation of the uptrend. And when a head and shoulders top forms as part of a downtrend, a break of the neckline is seen as a continuation of the downtrend. See below:
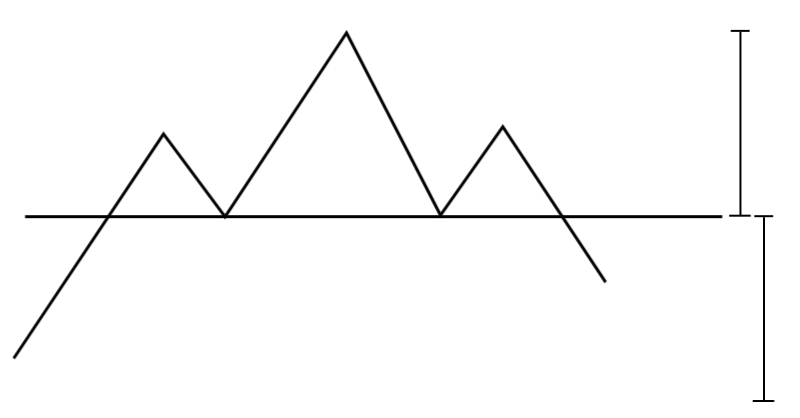
What about Targets?
In order to establish price targets for the head and shoulders pattern measure the vertical distance between the top of the head and the neckline in the case of a head and shoulders top; or in case of the head and shoulders bottom, measure the vertical distance between the low of the head and the neckline. Project this distance down from the neckline in case of a head and shoulders top and up from the neckline in case of head and shoulders bottom / reverse head and shoulders. This will be your minimum target that can be established for the head and shoulder pattern. See picture below of an example in the case of a head in shoulders top:
How is it Traded?
Some traders enter on the break of the neckline (support / resistance), others wait for a retest of the neckline (support / resistance) to enter but then risk missing the trade (if there is no retest), and then some traders will do both – that is enter a position on initial break and add a second position on the retest. There are other ways to enter but I just wanted to give you an idea of what can be done.
Finally:
Remember that in technical analysis chart patterns – no matter how powerful – don’t always play out 100 % – they can and do fail. The head and shoulders pattern – even though it is so popular – is no exception.
Thanks so much for reading. Hope you and the family are safe.
Thanks and Regards,
Trading SOS SOS