The Relative Strength Indicator (RSI) is a technical indicator that was created by J. Welles Wilder and is explained fully in his book, New Concepts in Technical Trading Systems.
The Relative Strength Indicator / RSI:
The RSI is a momentum indicator that measures the velocity / strength of price movements. Also, it records overbought and oversold readings of price.
The RSI calculates the ratio of up closes versus down closes over a period of time and the result is expressed as an oscillator with a scale from 0 – 100. See the formula below:
RSI = 100 – (100/(1 + RS))
In the above equation, RS = the average of the up closes (over certain period) divided by the average of the down closes (over the same period).
Wilder recommended using a time period of 14 (it is also the most common period used by traders).
Reading the RSI:
The RSI is an oscillator that fluctuates between 0 and 100. Normally it is plotted at the bottom of a price chart. Please refer to the chart below for the explanation that follows:
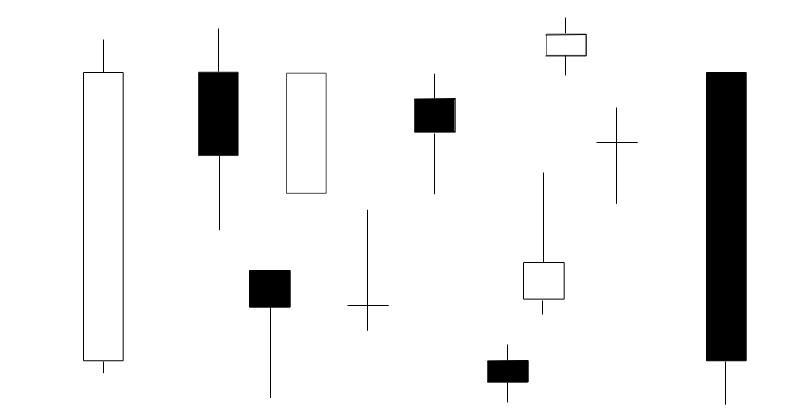
The solid line that fluctuates (bottom panel) is the RSI indicator itself.
When it comes to the 3 horizontal lines (bottom panel), the:
- middle line is called the neutral line and is plotted at level 50.
- lower line is plotted at 30.
- the upper line is plotted at level 70.
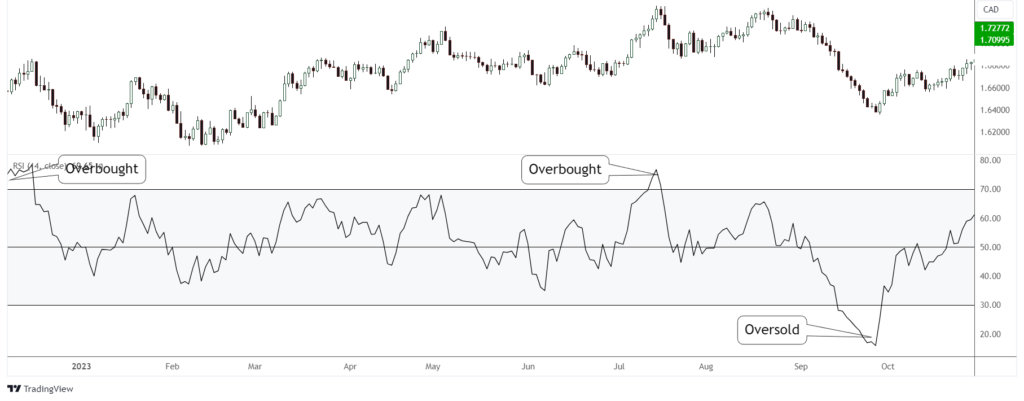
Overbought and Oversold:
Readings of the RSI indicator over 70 indicates an overbought condition, meaning a price reversal to the downside might be close. And readings below 30 indicates an oversold condition, suggesting a price reversal to the upside might be close. See below:
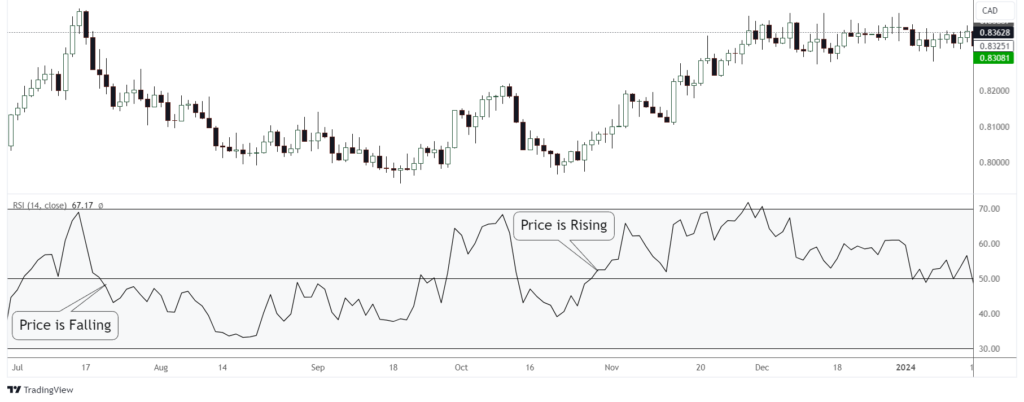
Trends:
When price and the RSI move in the same direction, it means that the RSI is confirming the trend. This is known as convergence.
Also, readings above 50 (the middle line) generally indicates that price is rising and readings below 50 indicates that price is falling. See below:
Pointers on Using the RSI:
Overbought and Oversold, again:
People love using the overbought and oversold signals of the RSI for trading reversals. Please don’t trade these signals blindly. Overbought and oversold works well in ranging markets, but not so well in trending markets.
Combining them with important levels such as support and resistance or looking for signs of reversal like reversal candlestick patterns helps to put the odds in your favor.
Trend Identification:
Just because the RSI crosses the neutral line doesn’t mean that the trend has changed, see it as a potential reversal instead. Always try to look for additional confirmation / reasons as to why the trend might be changing.
During Bull and Bear Markets:
In bull markets the RSI indicator will spend a lot of time above 50 (middle line) and vice versa in bear markets. In bull / bear markets, it can go (and stay) overbought / oversold frequently and for extended periods at a time. During such times its best to trade with the trend, or at the very least, not against it.
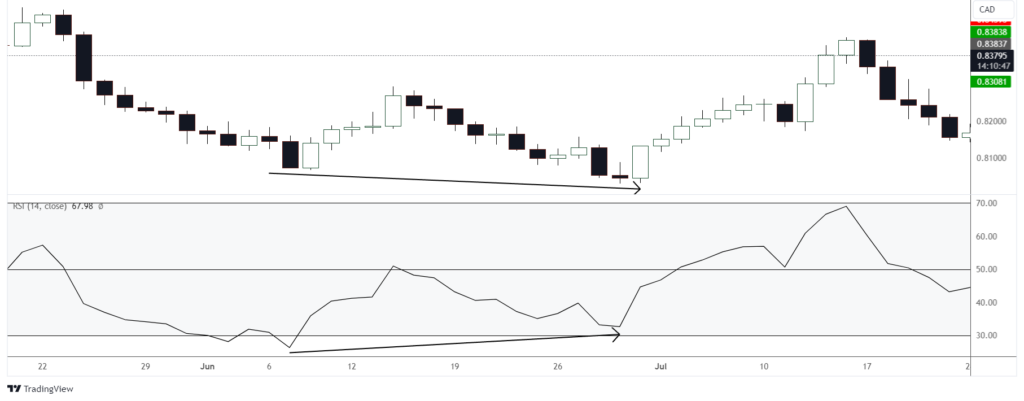
Divergence:
Divergence occurs less often than overbought and oversold conditions, but many traders see it as a more potent warning / sign of a potential price reversal.
A divergence occurs when price moves in one direction and the RSI moves in the opposite direction. Ideally the RSI is coming out of an extreme condition (overbought / oversold) at the start of the divergence.
With a bullish divergence, price makes lower lows while the RSI makes higher lows before the potential reversal. See below:
With a bearish divergence, price makes higher highs while the RSI makes lower highs before the potential reversal. See below:
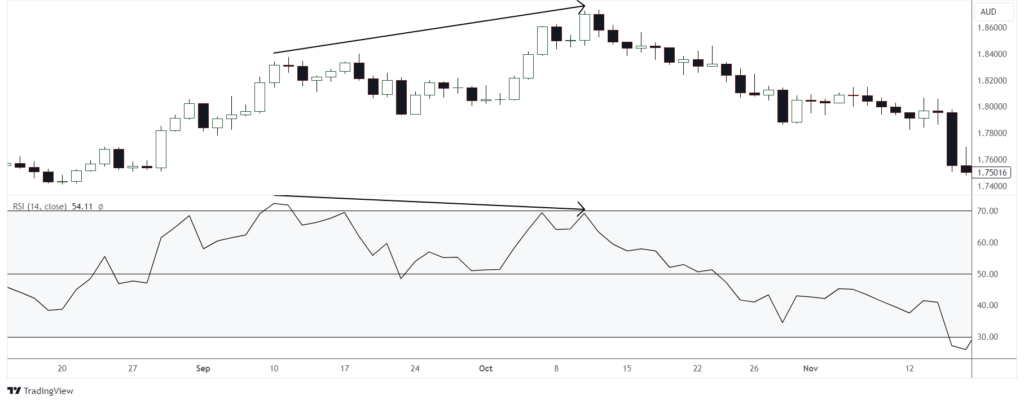
As with overbought and oversold conditions, don’t trade divergences blindly. Always look for additional information as confirmation.
Finally:
Please note that all the charts for this post were cherry picked for explanation purposes. In real trading, charts will not always set up as nicely. As with all indicators, it is best for the trader to study and pick what works best for him / her.
Thanks so much for reading. I hope that your trading is treating you well.
Thanks and Regards,
Trading SOS SOS