In this post I will cover the shooting and inverted hammer candlestick patterns (also known as pin bars to many traders). They are reversal candles, meaning they indicate that the prevailing market trend may come to an end. Before I go any further, if you are new to candlesticks, you can read about candlestick basics here.
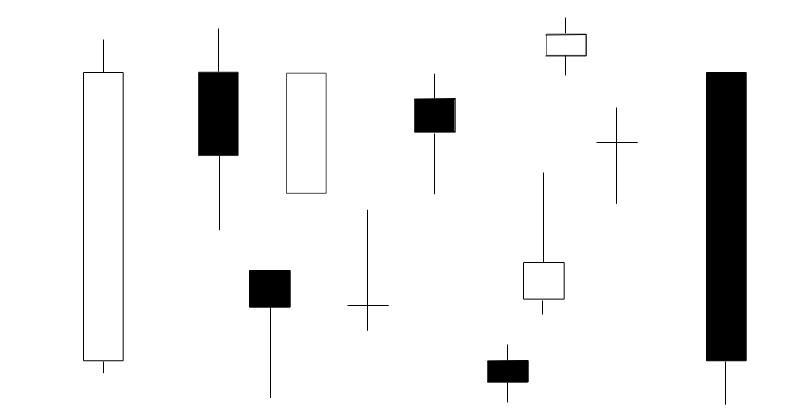
The Shooting Star and Inverted Hammer:
Both candlesticks look the same, but they can be bullish or bearish depending on where they form in a given market move as we will discuss shortly.
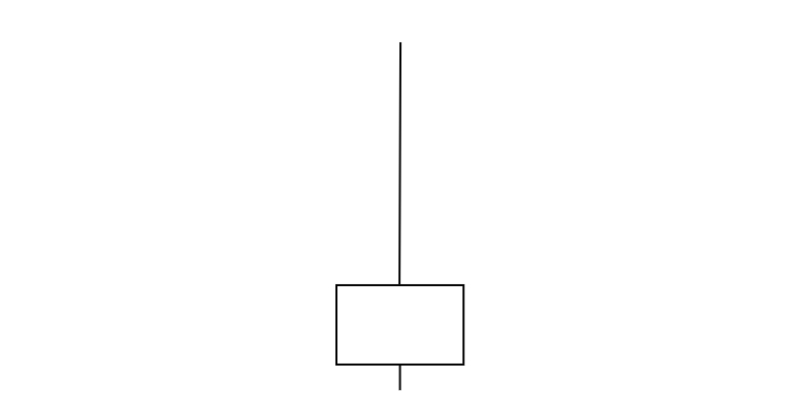
Firstly, the real body is small, their upper shadows should be at least twice the size of the real body, the color of the body doesn’t matter and they should have no or very small lower shadows. See picture below; remember the color of the body doesn’t matter:
The Shooting Star in Context:
A shooting star is a bearish reversal candlestick, which means it must come after a market rallied. Its appearance after an up move in a market suggests that the recent rally (up move) may reverse. See picture below:
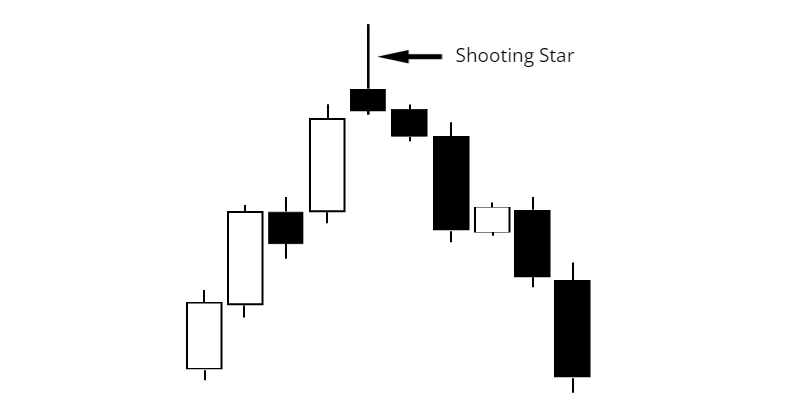
Note: The Shooting Star is a candlestick pattern that forms part of a larger group candles named stars. As with stars, the body of the shooting star should gap away from the body of the preceding candle… but many traders look only at the candle itself (long upper wick and small body) for confirmation as a potential reversal and don’t give too much attention to the gap (like in the case of the hammer).
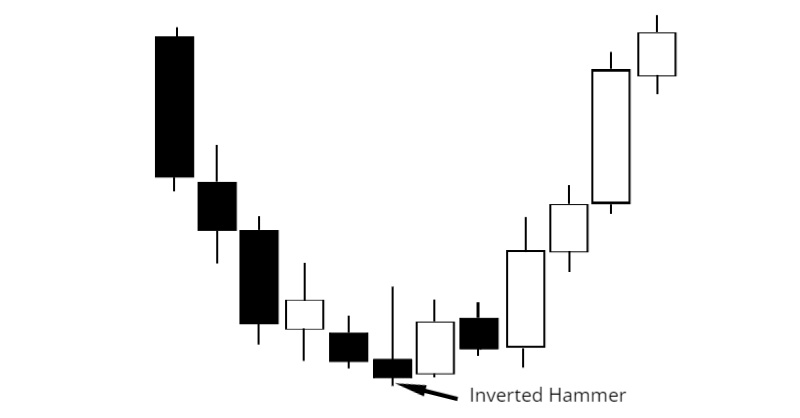
The Inverted Hammer in Context:
The inverted hammer is a bullish reversal candlestick, which means it must come after a market decline. Its appearance after a down move in a market suggests that the recent decline (down move) may reverse. The inverted hammer should be confirmed with a bullish candle. See picture below:
Finally:
These candles are more potent the smaller the real bodies and the longer the upper shadows. Also remember that the inverted hammer needs to be confirmed with a bullish candle, but not the shooting star. These candlestick patterns should not be traded blindly whenever they show up on a chart, but should be traded in context of the market … like trading them from areas of value such as support and resistance, for example.
Thanks so much for reading. I hope you enjoyed this post.
Thanks and Regards,
Trading SOS SOS