In this post I will explain the symmetrical triangle as a chart pattern being used by many traders as part of their trading arsenal. This pattern is very popular in the realm of technical analysis and can be either of the continuation or reversal type as you will see shortly.
The Symmetrical Triangle:
A symmetrical triangle consists of a series of at least two rallies and reactions of which the peaks make lower highs and the bottoms make higher lows. Another way of putting it is that a symmetrical triangle is a range / consolidation which is getting tighter and tighter; which is the reason that they are also known as coils. A minor trendline (resistance) can be drawn across the successive lower peaks (a declining line) and another minor trendline (support) can be drawn across the successive higher bottoms (a rising line). So the two lines are converging.
What happens here is that both buyers and sellers buy and sell sooner and sooner on each rally and decline because they are unsure about the market. The coiling shows this uncertainty. When the market finally breaks out of the triangle, there is new enthusiasm from either the bulls or the bears, depending on which way it broke (up = bullish, down = bearish).
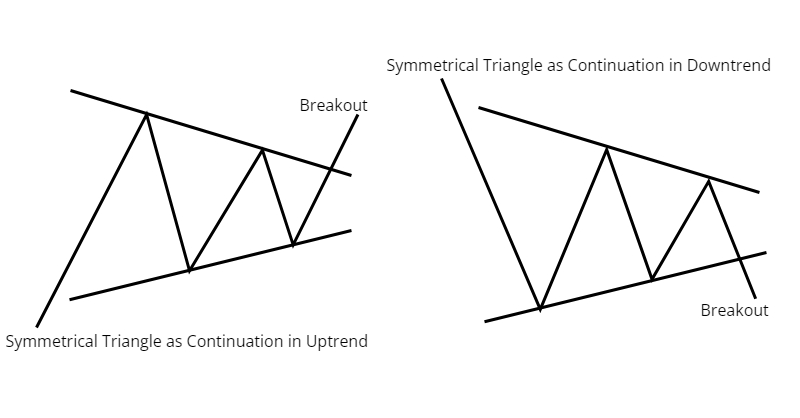
The Symmetrical Triangle as a Continuation Pattern:
When a symmetrical triangle forms in an uptrend then breaks and closes above the declining resistance line, it suggests a continuation of the uptrend. Also , when a symmetrical triangle forms in a downtrend, then breaks and closes below the rising support line, it suggests a continuation of the downtrend. In both cases the symmetrical triangle is of the continuation type. See picture below:
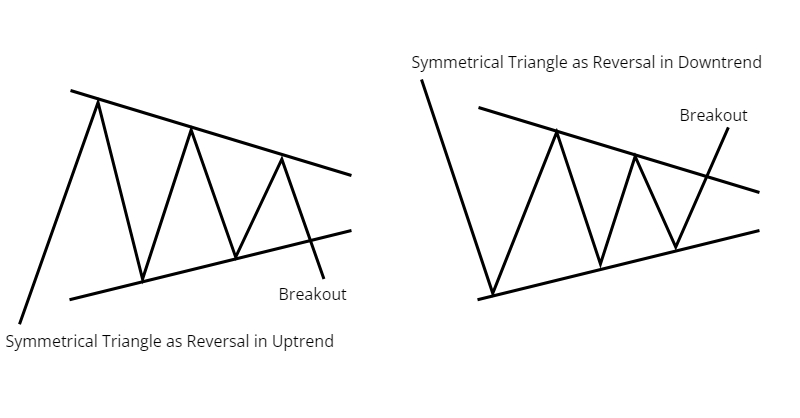
When a symmetrical triangle forms in an uptrend then breaks and closes below the rising support line, it suggests a reversal of the uptrend. Also , when a symmetrical triangle forms in a downtrend, then breaks and closes above the declining support line, it suggests a reversal of the downtrend. In both cases the symmetrical triangle is of the reversal type. See picture below:
The Symmetrical Triangle as a Reversal Pattern:
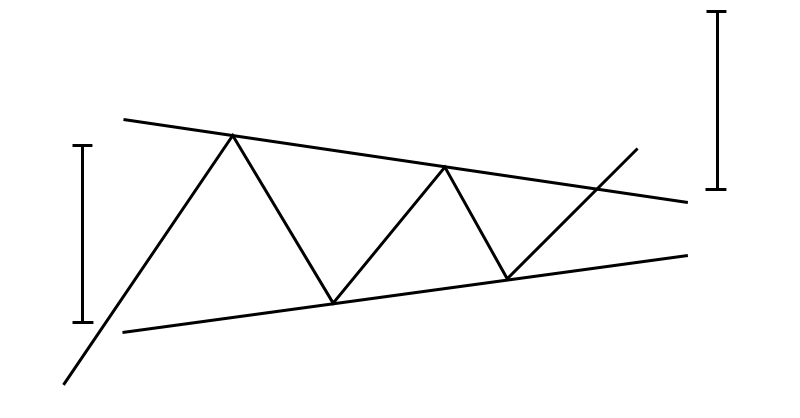
What about Targets?
To get a minimum price target for the symmetrical triangle, measure the height at the base of the triangle and project this length from the breakout point of the triangle. The picture below is an example for the continuation type in an uptrend. See below:
Some traders enter on the break of the support / resistance line, others wait for a retest of the support / resistance line after the break to enter, but then risk missing the trade (if there is no retest) and then some traders will do both – that is enter a position on initial break and add a second position on the retest. There are other ways to enter but I just wanted to give you an idea how it can be traded.
Finally:
Remember that in technical analysis chart patterns – no matter how powerful – don’t always play out 100 % always; they can and do fail. The symmetrical triangle is no exception.
Thank you so much for reading. Hope you enjoyed this post.
Thanks and Regards,
Trading SOS SOS