In this post I will explain triple tops and triple bottoms as chart patterns being used by many traders as part of their trading arsenal. They are classified as reversal patterns in technical analysis and are very popular.
The Triple Top and Triple Bottom:
The triple top is a bearish reversal pattern. Please refer to the picture below for the explanation that follows of the triple top. The first top of the triple top is part of the most recent high in an uptrend. Price then retraces and finds support. The second top is formed when price bounces from the support to the level of the first top where it finds resistance and retraces again towards the previous support. Price then bounces from support again to the level of the first 2 tops before it retraces towards support; this is the third top. The support line is called the neckline and only when price breaks below the neckline is a possible reversal in trend signaled. The three tops don’t have to be exactly the same height, but it should not vary too much. The tops should be evident and easy to identify.

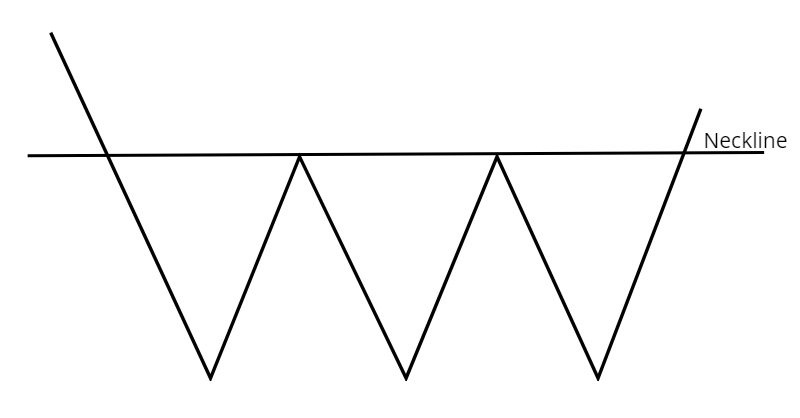
The triple bottom is a bullish reversal pattern. Please refer to the picture below for the explanation that follows of the triple bottom. The first bottom of the triple bottom is part of the most recent low in a downtrend. Price then bounces and finds resistance. The second bottom is formed when price falls from resistance to the level of the first bottom where it finds support and bounces again towards the previous resistance. Price then falls again from this resistance towards the support of the first 2 bottoms before it bounces again; this is the third bottom. The resistance line is called the neckline and only when price breaks above the neckline is a possible reversal in trend signalled. The three bottoms don’t have to be exactly the same height, but it should not vary too much. The bottoms should also be evident and easy to identify.
What about Targets?
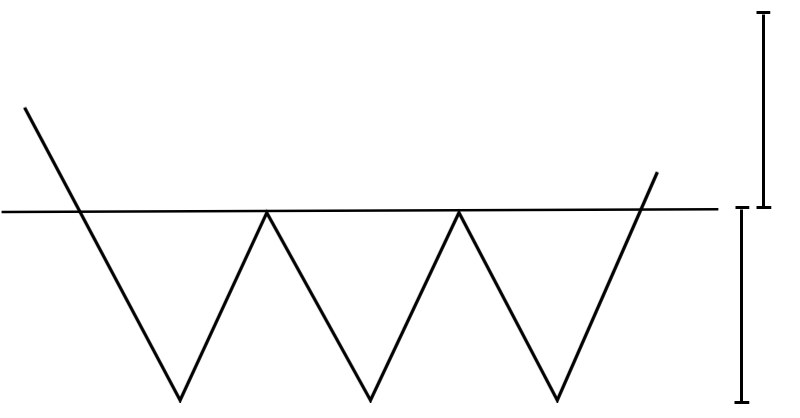
In order to establish price targets for the triple top and bottom, measure the vertical distance between the top and the neckline in the case of a triple top; or in case of a triple bottom, measure the vertical distance between the bottom and the neckline. Project this distance down from the neckline in case of a triple top and up from the neckline in case of triple bottom. This will be your minimum target. See picture below of an example in case of a triple bottom:
How can it be Traded?
Some traders enter on the break of the neckline (support / resistance), others wait for a retest of the neckline (support / resistance) to enter but then risk missing the trade (if there is no retest) and then some traders will do both – that is enter a position on initial break and add a second position on the retest. There are other ways to enter but I just wanted to give you an idea of what can be done.
Finally:
Remember that in technical analysis chart patterns – no matter how powerful – don’t always play out 100 % always; they can and do fail. The triple top and bottom patterns – even though they are very popular – are no exception.
Thanks so much for reading. Hope you and the family are safe.
Thanks and Regards,
Trading SOS SOS