In today’s post I will be discussing the inverse head and shoulders pattern that recently formed in the USDCHF forex pair. This was on the daily chart and the breakout happened on the 1st of February 2021. I will give my opinion / insight on how I think traders out there might / could have traded it; hoping readers gain some insight from it. Let’s start.
Refer to the chart of USDCHF below for all my comments.
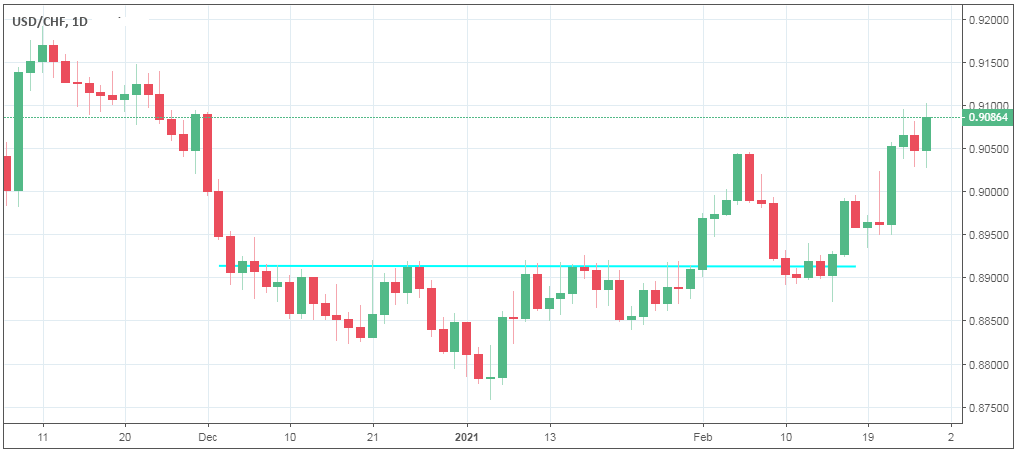
The inverse head and shoulders became evident once the rally started from the bottom of the right shoulder. With this in mind, some traders might have anticipated the breakout by buying as soon as that right shoulder became evident. In this case it would’ve worked in their favour and they would’ve had a very good reward to risk ratio. The downside to this is that many times the breakout never happens, which is required for the pattern to be completed, with the result being a loss more than likely.
By placing a buy stop order above the highs of the candles that forms part of the neckline of the is another way the trade might have been entered. Here it’s anticipated that once the order is triggered, price will keep moving in the same direction and close above the neckline. In the above chart it worked and gave a favourable reward to risk ratio. The drawback is that the buy stop could be triggered, but then close below the neckline at the end of the period (daily in this case). This again would mean that the pattern was not completed and the traders need to decide what they will do as the trade would be negative at the close of the session.
Those traders that were waiting for the break and close above the neckline would have been facing a very bad reward to risk ratio due to that big breakout candle. This is one of the main things breakout traders need to consider; meaning the size of the break and whether it’s still viable (especially in terms of reward to risk) to trade.
Then there are the traders that wait for a pullback after the breakout was confirmed. This can be done via limit orders. Another way is to wait for a retest of the neckline and an entry trigger to get into the trade. Here the neckline was tested and a bullish engulfing candle formed right on the neckline as a possible reason to enter. The upside with this is that you choose where you want to enter and so also determine your reward to risk. The downside is that price might never pullback and just shoot straight to the target.
Remember that although other ways were discussed here, only a close above the neckline completes an inverse head and shoulders (vice versa for a head and shoulders top). Those who bought before the break and close are jumping the gun, which worked great here, but won’t always be so lucky. Stops were not discussed here. Don’t go out and trade these ideas blindly please. Do some more research and always backtest before putting real money in the markets.
Thank you so much for reading. Hope you are all well.
Thanks and Regards,
Trading SOS SOS